Proctor and Gamble 2016 Annual Report Download - page 24
Download and view the complete annual report
Please find page 24 of the 2016 Proctor and Gamble annual report below. You can navigate through the pages in the report by either clicking on the pages listed below, or by using the keyword search tool below to find specific information within the annual report.-
 1
1 -
2
-
3
-
4
-
5
-
6
-
7
-
8
-
9
-
10
-
11
-
12
-
13
-
 14
14 -
 15
15 -
 16
16 -
 17
17 -
 18
18 -
 19
19 -
 20
20 -
 21
21 -
 22
22 -
 23
23 -
 24
24 -
 25
25 -
 26
26 -
 27
27 -
 28
28 -
 29
29 -
 30
30 -
 31
31 -
 32
32 -
 33
33 -
 34
34 -
35
-
36
-
37
-
38
-
39
-
40
-
41
-
42
-
43
-
44
-
45
-
46
-
47
-
48
-
49
-
50
-
51
-
52
-
53
-
54
-
55
-
56
-
57
-
58
-
59
-
60
-
61
-
62
-
63
-
64
-
65
-
66
-
67
-
68
-
69
-
70
-
71
-
72
-
73
-
74
-
75
-
76
-
77
-
78
-
79
-
80
-
81
-
82
-
83
-
84
-
85
-
86
-
87
-
88
-
89
-
90
-
91
-
92
 |
 |

10 The Procter & Gamble Company
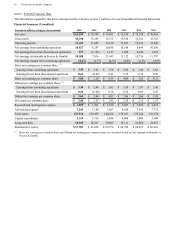
Item 6. Selected Financial Data.
The information required by this item is incorporated by reference to Note 1 and Note 2 to our Consolidated Financial Statements.
Financial Summary (Unaudited)
Amounts in millions, except per share amounts 2016 2015 2014 2013 2012 2011
Net sales $ 65,299 $ 70,749 $ 74,401 $ 73,910 $ 73,138 $ 70,464
Gross profit 32,390 33,693 35,371 35,858 35,254 35,110
Operating income 13,441 11,049 13,910 13,051 12,495 13,849
Net earnings from continuing operations 10,027 8,287 10,658 10,346 8,864 10,509
Net earnings/(loss) from discontinued operations 577 (1,143) 1,127 1,056 2,040 1,418
Net earnings attributable to Procter & Gamble 10,508 7,036 11,643 11,312 10,756 11,797
Net earnings margin from continuing operations 15.4% 11.7% 14.3% 14.0% 12.1% 14.9%
Basic net earnings per common share:
(1)
Earnings from continuing operations $3.59 $ 2.92 $ 3.78 $ 3.65 $ 3.08 $ 3.62
Earnings/(loss) from discontinued operations 0.21 (0.42) 0.41 0.39 0.74 0.50
Basic net earnings per common share $ 3.80 $ 2.50 $ 4.19 $ 4.04 $ 3.82 $ 4.12
Diluted net earnings per common share:
(1)
Earnings from continuing operations $3.49 $ 2.84 $ 3.63 $ 3.50 $ 2.97 $ 3.46
Earnings/(loss) from discontinued operations 0.20 (0.40) 0.38 0.36 0.69 0.47
Diluted net earnings per common share $ 3.69 $ 2.44 $ 4.01 $ 3.86 $ 3.66 $ 3.93
Dividends per common share $2.66 $ 2.59 $ 2.45 $ 2.29 $ 2.14 $ 1.97
Research and development expense $ 1,879 $ 1,991 $ 1,910 $ 1,867 $ 1,874 $ 1,812
Advertising expense 7,243 7,180 7,867 8,188 7,839 7,713
Total assets 127,136 129,495 144,266 139,263 132,244 138,354
Capital expenditures 3,314 3,736 3,848 4,008 3,964 3,306
Long-term debt 18,945 18,327 19,807 19,111 21,080 22,033
Shareholders' equity $ 57,983 $ 63,050 $ 69,976 $ 68,709 $ 64,035 $ 68,001
(1)
Basic net earnings per common share and Diluted net earnings per common share are calculated based on Net earnings attributable to
Procter & Gamble.