Proctor and Gamble 2016 Annual Report Download - page 44
Download and view the complete annual report
Please find page 44 of the 2016 Proctor and Gamble annual report below. You can navigate through the pages in the report by either clicking on the pages listed below, or by using the keyword search tool below to find specific information within the annual report.-
 1
1 -
2
-
3
-
4
-
5
-
6
-
7
-
8
-
9
-
10
-
11
-
12
-
13
-
14
-
15
-
16
-
17
-
18
-
19
-
20
-
21
-
22
-
23
-
24
-
25
-
26
-
27
-
28
-
29
-
30
-
31
-
32
-
33
-
 34
34 -
 35
35 -
 36
36 -
 37
37 -
 38
38 -
 39
39 -
 40
40 -
 41
41 -
 42
42 -
 43
43 -
 44
44 -
 45
45 -
 46
46 -
 47
47 -
 48
48 -
 49
49 -
 50
50 -
 51
51 -
 52
52 -
 53
53 -
 54
54 -
55
-
56
-
57
-
58
-
59
-
60
-
61
-
62
-
63
-
64
-
65
-
66
-
67
-
68
-
69
-
70
-
71
-
72
-
73
-
74
-
75
-
76
-
77
-
78
-
79
-
80
-
81
-
82
-
83
-
84
-
85
-
86
-
87
-
88
-
89
-
90
-
91
-
92
 |
 |

30 The Procter & Gamble Company
accordance with the applicable accounting standards for
consolidation, effective June 30, 2015, we deconsolidated
our Venezuelan subsidiaries and began accounting for our
investment in those subsidiaries using the cost method of
accounting. The charge was incurred to write off our net
assets related to Venezuela.
•Charges for certain European legal matters: Several
countries in Europe issued separate complaints alleging
that the Company, along with several other companies,
engaged in violations of competition laws in prior periods.
The Company established Legal Reserves related to these
charges. Management does not view these charges as
indicative of underlying business results.
•Venezuela Balance Sheet Remeasurement & Devaluation
Impacts: Venezuela is a highly inflationary economy
under U.S. GAAP. Prior to deconsolidation, the
government enacted episodic changes to currency
exchange mechanisms and rates, which resulted in
currency remeasurement charges for non-dollar
denominated monetary assets and liabilities held by our
Venezuelan subsidiaries.
We do not view the above items to be part of our sustainable
results, and their exclusion from core earnings measures
provides a more comparable measure of year-on-year results.
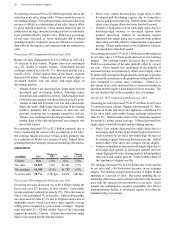
Years ended June 30 2016 2015 2014
Diluted net earnings per share -
continuing operations $3.49 $2.84 $3.63
Incremental restructuring charges 0.18 0.17 0.11
Venezuela balance sheet
devaluation impacts —0.04 0.09
Charges for European legal matters —0.01 0.02
Venezuelan deconsolidation —0.71 —
Rounding —(0.01) —
CORE EPS $3.67 $3.76 $3.85
Core EPS Growth (2)% (2)% 5%
* All reconciling items are presented net of tax. Tax effects are
calculated consistent with the nature of the underlying transaction.
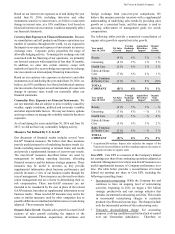
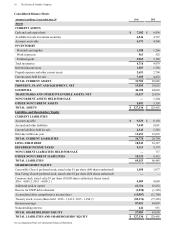
Adjusted Free Cash Flow. Adjusted free cash flow is defined
as operating cash flow less capital spending excluding tax
payments related to the divestiture of the discontinued Pet
business. Adjusted free cash flow represents the cash that the
Company is able to generate after taking into account planned
maintenance and asset expansion. We view adjusted free cash
flow as an important measure because it is one factor used in
determining the amount of cash available for dividends, share
repurchases, acquisitions and other discretionary investment.
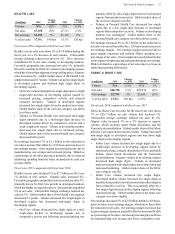
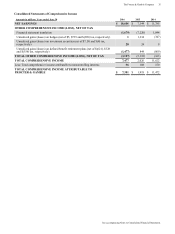
The following table provides a numerical reconciliation of
adjusted free cash flow ($ millions):
Operating
Cash
Flow
Capital
Spending
Free
Cash
Flow
Divestiture
impacts*
Adjusted
Free
Cash Flow
2016 $ 15,435 $ (3,314) $ 12,121 $ — $ 12,121
2015 14,608 (3,736) 10,872 729 11,601
2014 13,958 (3,848) 10,110 — 10,110
* Divestiture impacts relate to tax payments for the Pet Care
divestiture in fiscal 2015.
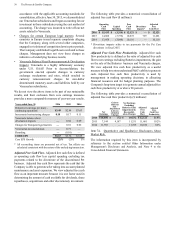
Adjusted Free Cash Flow Productivity. Adjusted free cash
flow productivity is defined as the ratio of adjusted free cash
flow to net earnings excluding Batteries impairments, the gain
on the sale of the Batteries business and Venezuela charges.
We view adjusted free cash flow productivity as a useful
measure to help investors understand P&G’s ability to generate
cash. Adjusted free cash flow productivity is used by
management in making operating decisions, in allocating
financial resources and for budget planning purposes. The
Company's long-term target is to generate annual adjusted free
cash flow productivity at or above 90 percent.
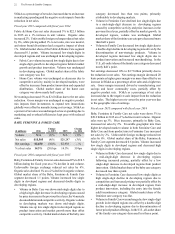
The following table provides a numerical reconciliation of
adjusted free cash flow productivity ($ millions):
Net
Earnings
Gain on
Batteries
Sale /
Impairment
&Decon-
solidation
Charges
Net Earnings
Excluding
Batteries Gain/
Impairment &
Deconsolid-
ation Charges
Adjusted
Free
Cash
Flow
Adjusted
Free
Cash Flow
Productivity
2016 $10,604 $ (72) $ 10,532 $ 12,121 115%
2015 7,144 4,187 11,331 11,601 102 %
2014 11,785 — 11,785 10,100 86 %
Item 7A. Quantitative and Qualitative Disclosures About
Market Risk.
The information required by this item is incorporated by
reference to the sect
ion entitled Other Information under
Management's Disclosure and Analysis, and Note 9 to the
Consolidated Financial Statements.