Proctor and Gamble 2016 Annual Report Download - page 43
Download and view the complete annual report
Please find page 43 of the 2016 Proctor and Gamble annual report below. You can navigate through the pages in the report by either clicking on the pages listed below, or by using the keyword search tool below to find specific information within the annual report.-
 1
1 -
2
-
3
-
4
-
5
-
6
-
7
-
8
-
9
-
10
-
11
-
12
-
13
-
14
-
15
-
16
-
17
-
18
-
19
-
20
-
21
-
22
-
23
-
24
-
25
-
26
-
27
-
28
-
29
-
30
-
31
-
32
-
 33
33 -
 34
34 -
 35
35 -
 36
36 -
 37
37 -
 38
38 -
 39
39 -
 40
40 -
 41
41 -
 42
42 -
 43
43 -
 44
44 -
 45
45 -
 46
46 -
 47
47 -
 48
48 -
 49
49 -
 50
50 -
 51
51 -
 52
52 -
 53
53 -
54
-
55
-
56
-
57
-
58
-
59
-
60
-
61
-
62
-
63
-
64
-
65
-
66
-
67
-
68
-
69
-
70
-
71
-
72
-
73
-
74
-
75
-
76
-
77
-
78
-
79
-
80
-
81
-
82
-
83
-
84
-
85
-
86
-
87
-
88
-
89
-
90
-
91
-
92
 |
 |

The Procter & Gamble Company 29
Based on our interest rate exposure as of and during the year
ended June 30, 2016, including derivative and other
instruments sensitive to interest rates, we believe a near-term
change in interest rates, at a 95% confidence level based on
historical interest rate movements, would not materially affect
our financial statements.
Currency Rate Exposure on Financial Instruments. Because
we manufacture and sell products and finance operations in a
number of countries throughout the world, we are exposed to
the impact on revenue and expenses of movements in currency
exchange rates. Corporate policy prescribes the range of
allowable hedging activity. To manage the exchange rate risk
associated with the financing of our operations, we primarily
use forward contracts with maturities of less than 18 months.
In addition, we enter into certain currency swaps with
maturities of up to five years to hedge our exposure to exchange
rate movements on intercompany financing transactions.
Based on our currency rate exposure on derivative and other
instruments as of and during the year ended June 30, 2016, we
believe, at a 95% confidence level based on historical currency
rate movements, the impact on such instruments of a near-term
change in currency rates would not materially affect our
financial statements.
Commodity Price Exposure on Financial Instruments. We
use raw materials that are subject to price volatility caused by
weather, supply conditions, political and economic variables
and other unpredictable factors. We may use futures, options
and swap contracts to manage the volatility related to the above
exposures.
As of and during the years ended June 30, 2016 and June 30,
2015, we did not have any commodity hedging activity.
Measures Not Defined By U.S. GAAP
Our discussion of financial results includes several "non-
GAAP" financial measures. We believe that these measures
provide useful perspective of underlying business trends (i.e.
trends excluding non-recurring or unusual items) and results
and provide a supplemental measure of year-on-year results.
The non-GAAP measures described below are used by
management in making operating decisions, allocating
financial resources and for business strategy purposes. These
measures may be useful to investors as they provide
supplemental information about business performance and
provide investors a view of our business results through the
eyes of management. These measures are also used to evaluate
senior management and are a factor in determining their at-
risk compensation. These non-GAAP measures are not
intended to be considered by the user in place of the related
GAAP measure, but rather as supplemental information to our
business results. These non-GAAP measures may not be the
same as similar measures used by other companies due to
possible differences in method and in the items or events being
adjusted. These measures include:
Organic Sales Growth. Organic sales growth is a non-GAAP
measure of sales growth excluding the impacts of the
Venezuela deconsolidation, acquisitions, divestitures and
foreign exchange from year-over-year comparisons. We
believe this measure provides investors with a supplemental
understanding of underlying sales trends by providing sales
growth on a consistent basis, and this measure is used in
assessing achievement of management goals for at-risk
compensation.
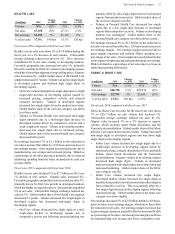
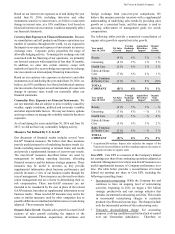
The following tables provide a numerical reconciliation of
organic sales growth to reported net sales growth:
Year ended
June 30, 2016
Net Sales
Growth
Foreign
Exchange
Impact
Acquisition/
Divestiture
Impact*
Organic
Sales
Growth
Beauty (9 )% 6 % 3 % — %
Grooming (8 )% 9 % 1 % 2 %
Health Care (5 )% 6 % 1 % 2 %
Fabric & Home
Care (7 )% 6 % 2 % 1 %
Baby, Feminine
& Family Care (9 )% 6 % 2 % (1)%
TOTAL
COMPANY (8)% 6% 3% 1 %
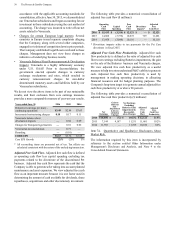
Year ended
June 30, 2015
Net Sales
Growth
Foreign
Exchange
Impact
Acquisition/
Divestiture
Impact*
Organic
Sales
Growth
Beauty (6 )% 5 % 1 % — %
Grooming (7 )% 8 % — % 1 %
Health Care (1 )% 5 % — % 4 %
Fabric & Home
Care (5 )% 6 % 1 % 2 %
Baby, Feminine
& Family Care (3 )% 6 % — % 3 %
TOTAL
COMPANY (5)% 6% 1% 2 %
* Acquisition/Divestiture Impact also includes the impact of the
Venezuela deconsolidation and the rounding impacts necessary to
reconcile net sales to organic sales.
Core EPS. Core EPS is a measure of the Company's diluted
net earnings per share from continuing operations adjusted as
indicated. Management views these non-GAAP measures as a
useful supplemental measure of Company performance over
time. The table below provides a reconciliation of revised
diluted net earnings per share to Core EPS, including the
following reconciling items:
•Incremental restructuring: While the Company has and
continues to have an ongoing level of restructuring
activities, beginning in 2012 we began a $10 billion
strategic productivity and cost savings initiative that
includes incremental restructuring activities. This results
in incremental restructuring charges to accelerate
productivity efforts and cost savings. The charges include
only the incremental portion of the restructuring costs.
•Venezuela deconsolidation charge: For accounting
purposes, evolving conditions resulted in a lack of control
over our Venezuelan subsidiaries. Therefore, in