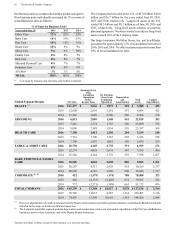
Proctor and Gamble 2016 Annual Report Download - page 66
Download and view the complete annual report
Please find page 66 of the 2016 Proctor and Gamble annual report below. You can navigate through the pages in the report by either clicking on the pages listed below, or by using the keyword search tool below to find specific information within the annual report.-
 1
1 -
2
-
3
-
4
-
5
-
6
-
7
-
8
-
9
-
10
-
11
-
12
-
13
-
14
-
15
-
16
-
17
-
18
-
19
-
20
-
21
-
22
-
23
-
24
-
25
-
26
-
27
-
28
-
29
-
30
-
31
-
32
-
33
-
34
-
35
-
36
-
37
-
38
-
39
-
40
-
41
-
42
-
43
-
44
-
45
-
46
-
47
-
48
-
49
-
50
-
51
-
52
-
53
-
54
-
55
-
 56
56 -
 57
57 -
 58
58 -
 59
59 -
 60
60 -
 61
61 -
 62
62 -
 63
63 -
 64
64 -
 65
65 -
 66
66 -
 67
67 -
 68
68 -
 69
69 -
 70
70 -
 71
71 -
 72
72 -
 73
73 -
 74
74 -
 75
75 -
 76
76 -
77
-
78
-
79
-
80
-
81
-
82
-
83
-
84
-
85
-
86
-
87
-
88
-
89
-
90
-
91
-
92
 |
 |

52 The Procter & Gamble Company
Amounts in millions of dollars except per share amounts or as otherwise specified.
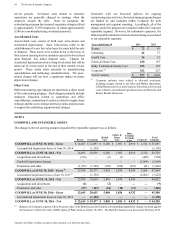
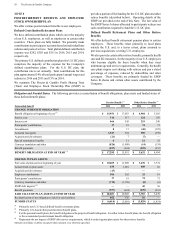
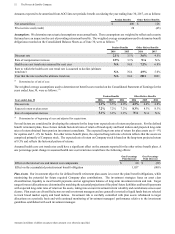
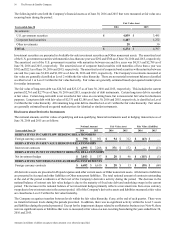
Amounts expected to be amortized from AOCI into net periodic benefit cost during the year ending June 30, 2017, are as follows:
Pension Benefits Other Retiree Benefits
Net actuarial loss $ 400 $ 126
Prior service cost/(credit) 28 (45)
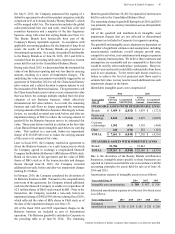
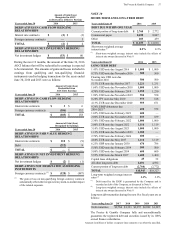
Assumptions.We determine our actuarial assumptions on an annual basis. These assumptions are weighted to reflect each country
that may have an impact on the cost of providing retirement benefits. The weighted average assumptions used to determine benefit
obligations recorded on the Consolidated Balance Sheets as of June 30, were as follows:
(1)
Pension Benefits Other Retiree Benefits
2016 2015 2016 2015
Discount rate 2.1% 3.1% 3.6% 4.5%
Rate of compensation increase 2.9% 3.1% N/A N/A
Health care cost trend rates assumed for next year N/A N/A 7.2% 6.8%
Rate to which the health care cost trend rate is assumed to decline (ultimate
trend rate) N/A N/A 4.9% 5.0%
Year that the rate reaches the ultimate trend rate N/A N/A 2021 2021
(1)
Determined as of end of year.
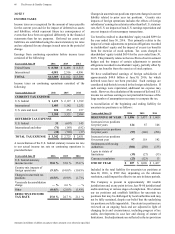
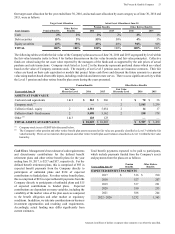
The weighted average assumptions used to determine net benefit cost recorded on the Consolidated Statement of Earnings for the
years ended June 30, were as follows:
(1)
Pension Benefits Other Retiree Benefits
Years ended June 30 2016 2015 2014 2016 2015 2014
Discount rate
3.1% 3.5% 4.0% 4.5% 4.4% 4.8%
Expected return on plan assets
7.2% 7.2% 7.2% 8.3% 8.3% 8.3%
Rate of compensation increase
3.1% 3.2% 3.2% N/A N/A N/A
(1)
Determined as of beginning of year and adjusted for acquisitions.
Several factors are considered in developing the estimate for the long-term expected rate of return on plan assets. For the defined
benefit retirement plans, these factors include historical rates of return of broad equity and bond indices and projected long-term
rates of return obtained from pension investment consultants. The expected long-term rates of return for plan assets are 8 - 9%
for equities and 5 - 6% for bonds. For other retiree benefit plans, the expected long-term rate of return reflects that the assets are
comprised primarily of Company stock. The expected rate of return on Company stock is based on the long-term projected return
of 8.5% and reflects the historical pattern of returns.
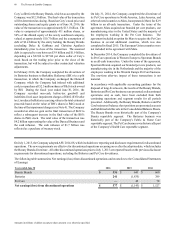
Assumed health care cost trend rates could have a significant effect on the amounts reported for the other retiree benefit plans. A
one percentage point change in assumed health care cost trend rates would have the following effects:
One-Percentage
Point Increase
One-Percentage
Point Decrease
Effect on the total service and interest cost components $ 80 $ (59)
Effect on the accumulated postretirement benefit obligation 1,057 (809)
Plan Assets.Our investment objective for defined benefit retirement plan assets is to meet the plans' benefit obligations, while
minimizing the potential for future required Company plan contributions. The investment strategies focus on asset class
diversification, liquidity to meet benefit payments and an appropriate balance of long-term investment return and risk. Target
ranges for asset allocations are determined by matching the actuarial projections of the plans' future liabilities and benefit payments
with expected long-term rates of return on the assets, taking into account investment return volatility and correlations across asset
classes. Plan assets are diversified across several investment managers and are generally invested in liquid funds that are selected
to track broad market equity and bond indices. Investment risk is carefully controlled with plan assets rebalanced to target
allocations on a periodic basis and with continual monitoring of investment managers' performance relative to the investment
guidelines established with each investment manager.