Proctor and Gamble 2016 Annual Report Download - page 33
Download and view the complete annual report
Please find page 33 of the 2016 Proctor and Gamble annual report below. You can navigate through the pages in the report by either clicking on the pages listed below, or by using the keyword search tool below to find specific information within the annual report.-
 1
1 -
2
-
3
-
4
-
5
-
6
-
7
-
8
-
9
-
10
-
11
-
12
-
13
-
14
-
15
-
16
-
17
-
18
-
19
-
20
-
21
-
22
-
 23
23 -
 24
24 -
 25
25 -
 26
26 -
 27
27 -
 28
28 -
 29
29 -
 30
30 -
 31
31 -
 32
32 -
 33
33 -
 34
34 -
 35
35 -
 36
36 -
 37
37 -
 38
38 -
 39
39 -
 40
40 -
 41
41 -
 42
42 -
 43
43 -
44
-
45
-
46
-
47
-
48
-
49
-
50
-
51
-
52
-
53
-
54
-
55
-
56
-
57
-
58
-
59
-
60
-
61
-
62
-
63
-
64
-
65
-
66
-
67
-
68
-
69
-
70
-
71
-
72
-
73
-
74
-
75
-
76
-
77
-
78
-
79
-
80
-
81
-
82
-
83
-
84
-
85
-
86
-
87
-
88
-
89
-
90
-
91
-
92
 |
 |

The Procter & Gamble Company 19
SEGMENT RESULTS
Segment results reflect information on the same basis we use for internal management reporting and performance evaluation. The
results of these reportable segments do not include certain non-business unit specific costs such as interest expense, investing
activities and certain restructuring and asset impairment costs. These costs are reported in our Corporate segment and are included
as part of our Corporate segment discussion. Additionally, as described in Note 2 to the Consolidated Financial Statements, we
apply blended statutory tax rates in the segments. Eliminations to adjust segment results to arrive at our effective tax rate are
included in Corporate. All references to net earnings throughout the discussion of segment results refer to net earnings from
continuing operations.
Net Sales Change Drivers 2016 vs. 2015*
Volume with
Acquisitions &
Divestitures
Volume
Excluding
Acquisitions &
Divestitures
Foreign
Exchange Price Mix Other**
Net Sales
Growth
Beauty (5 )% (2 )% (6 )% 2 % — % — % (9 )%
Grooming (2 )% (2 )% (9 )% 5 % (2)% — % (8 )%
Health Care (2 )% (2 )% (6 )% 2% 1 % —% (5 )%
Fabric & Home Care (1 )% 1 % (6 )% —% — % —% (7 )%
Baby, Feminine & Family Care (3 )% (2 )% (6 )% —% — % —% (9 )%
TOTAL COMPANY (3)% (1)% (6)% 1% — % —% (8)%
Net Sales Change Drivers 2015 vs. 2014*
Volume with
Acquisitions &
Divestitures
Volume
Excluding
Acquisitions &
Divestitures
Foreign
Exchange Price Mix Other**
Net Sales
Growth
Beauty (3 )% (2 )% (5 )% 2 % — % — % (6 )%
Grooming (3 )% (3 )% (8 )% 4 % — % — % (7 )%
Health Care (1 )% (1 )% (5 )% 2 % 3 % — % (1 )%
Fabric & Home Care 1 % 1 % (6 )% 1 % — % (1 )% (5 )%
Baby, Feminine & Family Care (1 )% (1 )% (6 )% 2 % 2 % — % (3 )%
TOTAL COMPANY (1)% (1)% (6)% 2% 1% (1)% (5)%
* Net sales percentage changes are approximations based on quantitative formulas that are consistently applied.
** Other includes the sales mix impact from acquisitions and divestitures and rounding impacts necessary to reconcile volume to net sales.
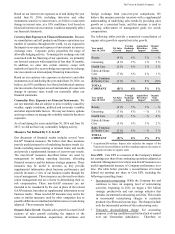
BEAUTY
($ millions) 2016
Change
vs. 2015 2015
Change
vs. 2014
Volume N/A (5)% N/A (3)%
Net sales $11,477 (9)% $12,608 (6)%
Net earnings $1,975 (9)% $2,181 (5)%
% of net sales 17.2% (10) bps 17.3% 10 bps
Fiscal year 2016 compared with fiscal year 2015
Beauty net sales decreased 9% to $11.5 billion during the fiscal
year on a 5% decrease in unit volume. Unfavorable foreign
exchange reduced net sales by 6%. Price increases had a 2%
positive impact on net sales. Organic sales were unchanged
on organic volume that decreased 2%. Global market share of
the Beauty segment decreased 1.0 points. Volume decreased
low single digits in developed markets and decreased high
single digits in developing markets.
• Volume in Hair Care was down mid-single digits.
Developed markets declined mid-single digits due to
competitive activity while developing markets declined
mid-single digits driven by increased pricing, the
Venezuela deconsolidation and minor brand divestitures.
Global market share of the hair care category decreased
more than a point.
• Volume in Skin and Personal Care decreased high single
digits, while organic volume decreased low single digits,
with the difference attributable to the Camay and Zest
brand divestitures and the Venezuela deconsolidation.
Organic volume was unchanged in developed regions as
commercial innovation was offset by ongoing competitive
activity. Organic volume declined mid-single digits in
developing regions primarily due to increased pricing and
competitive activity. Global market share of the skin and
personal care category decreased nearly a point.