Proctor and Gamble 2016 Annual Report Download - page 67
Download and view the complete annual report
Please find page 67 of the 2016 Proctor and Gamble annual report below. You can navigate through the pages in the report by either clicking on the pages listed below, or by using the keyword search tool below to find specific information within the annual report.-
 1
1 -
2
-
3
-
4
-
5
-
6
-
7
-
8
-
9
-
10
-
11
-
12
-
13
-
14
-
15
-
16
-
17
-
18
-
19
-
20
-
21
-
22
-
23
-
24
-
25
-
26
-
27
-
28
-
29
-
30
-
31
-
32
-
33
-
34
-
35
-
36
-
37
-
38
-
39
-
40
-
41
-
42
-
43
-
44
-
45
-
46
-
47
-
48
-
49
-
50
-
51
-
52
-
53
-
54
-
55
-
56
-
 57
57 -
 58
58 -
 59
59 -
 60
60 -
 61
61 -
 62
62 -
 63
63 -
 64
64 -
 65
65 -
 66
66 -
 67
67 -
 68
68 -
 69
69 -
 70
70 -
 71
71 -
 72
72 -
 73
73 -
 74
74 -
 75
75 -
 76
76 -
 77
77 -
78
-
79
-
80
-
81
-
82
-
83
-
84
-
85
-
86
-
87
-
88
-
89
-
90
-
91
-
92
 |
 |

The Procter & Gamble Company 53
Amounts in millions of dollars except per share amounts or as otherwise specified.
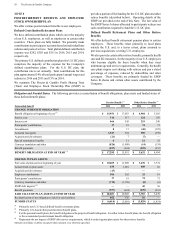
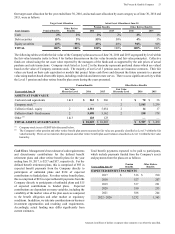
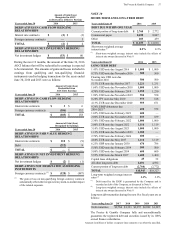
Our target asset allocation for the year ended June 30, 2016, and actual asset allocation by asset category as of June 30, 2016 and
2015, were as follows:
Target Asset Allocation Actual Asset Allocation at June 30
Pension Benefits
Other Retiree
Benefits
Pension Benefits Other Retiree Benefits
Asset Category 2016 2015 2016 2015
Cash 2% 2% 2% 2% 2% 1%
Debt securities 55% 3% 55% 50% 4% 5%
Equity securities 43% 95% 43% 48% 94% 94%
TOTAL 100% 100% 100% 100% 100% 100%
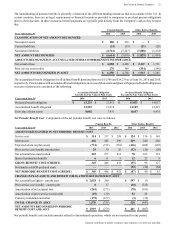
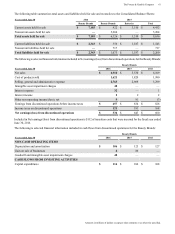
The following tables set forth the fair value of the Company's plan assets as of June 30, 2016 and 2015 segregated by level within
the fair value hierarchy (refer to Note 9 for further discussion on the fair value hierarchy and fair value principles). Collective
funds are valued using the net asset value reported by the managers of the funds and as supported by the unit prices of actual
purchase and sale transactions. Company stock listed as Level 2 in the hierarchy represents preferred shares which are valued
based on the value of Company common stock. The majority of our Level 3 pension assets are insurance contracts. Their fair
values are based on their cash equivalent or models that project future cash flows and discount the future amounts to a present
value using market-based observable inputs, including credit risk and interest rate curves. There was no significant activity within
the Level 3 pension and other retiree benefits plan assets during the years presented.
Pension Benefits Other Retiree Benefits
Years ended June 30
Fair Value
Hierarchy Level 2016 2015
Fair Value
Hierarchy Level 2016 2015
ASSETS AT FAIR VALUE
Cash and cash equivalents 1 & 2 $ 262 $ 266 1 $70
$36
Company stock
(1)
——2 3,545 3,239
Collective fund - equity 2 4,381 5,054 2 14 17
Collective fund - fixed income 2 5,498 5,162 2 158 178
Other
(2)
1&3 128 123 ——
TOTAL ASSETS AT FAIR VALUE $ 10,269 $ 10,605 $ 3,787 $ 3,470
(1)
Company stock is net of ESOP debt discussed below.
(2)
The Company's other pension and other retiree benefit plan assets measured at fair value are generally classified as Level 3 within the fair
value hierarchy. There are no material other pension and other retiree benefit plan asset balances classified as Level 1 within the fair value
hierarchy.
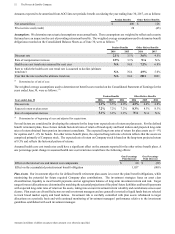
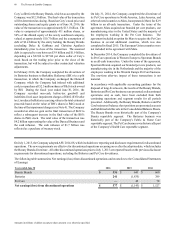
Cash Flows.Management's best estimate of cash requirements
and discretionary contributions for the defined benefit
retirement plans and other retiree benefit plans for the year
ending June 30, 2017, is $217 and $37, respectively. For the
defined benefit retirement plans, this is comprised of $93 in
expected benefit payments from the Company directly to
participants of unfunded plans and $124 of expected
contributions to funded plans. For other retiree benefit plans,
this is comprised of $22 in expected benefit payments from the
Company directly to participants of unfunded plans and $15
of expected contributions to funded plans. Expected
contributions are dependent on many variables, including the
variability of the market value of the plan assets as compared
to the benefit obligation and other market or regulatory
conditions. In addition, we take into consideration our business
investment opportunities and resulting cash requirements.
Accordingly, actual funding may differ significantly from
current estimates.
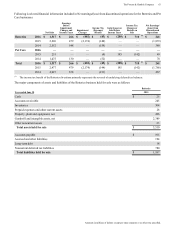
Total benefit payments expected to be paid to participants,
which include payments funded from the Company's assets
and payments from the plans are as follows:
Years ending June 30
Pension
Benefits
Other Retiree
Benefits
EXPECTED BENEFIT PAYMENTS
2017 $ 516 $ 190
2018 527 207
2019 537 221
2020 550 233
2021 588 244
2022 - 2026 3,232 1,365