Proctor and Gamble 2016 Annual Report Download - page 57
Download and view the complete annual report
Please find page 57 of the 2016 Proctor and Gamble annual report below. You can navigate through the pages in the report by either clicking on the pages listed below, or by using the keyword search tool below to find specific information within the annual report.-
 1
1 -
2
-
3
-
4
-
5
-
6
-
7
-
8
-
9
-
10
-
11
-
12
-
13
-
14
-
15
-
16
-
17
-
18
-
19
-
20
-
21
-
22
-
23
-
24
-
25
-
26
-
27
-
28
-
29
-
30
-
31
-
32
-
33
-
34
-
35
-
36
-
37
-
38
-
39
-
40
-
41
-
42
-
43
-
44
-
45
-
46
-
 47
47 -
 48
48 -
 49
49 -
 50
50 -
 51
51 -
 52
52 -
 53
53 -
 54
54 -
 55
55 -
 56
56 -
 57
57 -
 58
58 -
 59
59 -
 60
60 -
 61
61 -
 62
62 -
 63
63 -
 64
64 -
 65
65 -
 66
66 -
 67
67 -
68
-
69
-
70
-
71
-
72
-
73
-
74
-
75
-
76
-
77
-
78
-
79
-
80
-
81
-
82
-
83
-
84
-
85
-
86
-
87
-
88
-
89
-
90
-
91
-
92
 |
 |

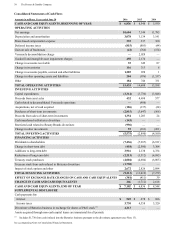
The Procter & Gamble Company 43
Amounts in millions of dollars except per share amounts or as otherwise specified.
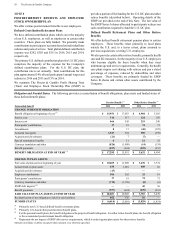
NOTE 3
SUPPLEMENTAL FINANCIAL INFORMATION
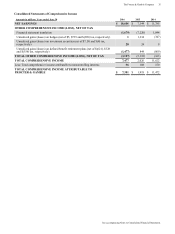
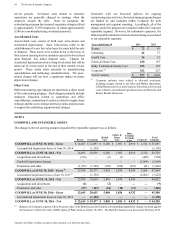
The components of property, plant and equipment were as
follows:
Years ended June 30 2016 2015
PROPERTY, PLANT AND EQUIPMENT
Buildings $ 6,885 $ 6,949
Machinery and equipment 29,506 29,420
Land 769 763
Construction in progress 2,706 2,931
TOTAL PROPERTY, PLANT
AND EQUIPMENT 39,866 40,063
Accumulated depreciation (20,481) (20,408)
PROPERTY, PLANT AND
EQUIPMENT, NET $ 19,385 $ 19,655
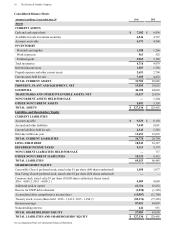
Selected components of current and noncurrent liabilities were
as follows:
Years ended June 30 2016 2015
ACCRUED AND OTHER LIABILITIES - CURRENT
Marketing and promotion $ 2,820 $ 2,798
Compensation expenses 1,457 1,390
Restructuring reserves 315 389
Taxes payable 397 845
Legal and environmental 158 205
Other 2,302 2,464
TOTAL $ 7,449 $ 8,091
OTHER NONCURRENT LIABILITIES
Pension benefits $ 6,761 $ 5,247
Other postretirement benefits 1,808 1,414
Uncertain tax positions 952 1,016
Other 804 755
TOTAL $ 10,325 $ 8,432
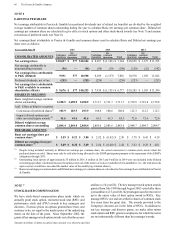
RESTRUCTURING PROGRAM
The Company has historically incurred an ongoing annual level
of restructuring-type activities to maintain a competitive cost
structure, including manufacturing and workforce
optimization. Before-tax costs incurred under the ongoing
program have generally ranged from $250 to $500 annually.
In fiscal 2012, the Company initiated an incremental
restructuring program as part of a productivity and cost savings
plan to reduce costs in the areas of supply chain, research and
development, marketing and overheads. The productivity and
cost savings plan was designed to accelerate cost reductions
by streamlining management decision making, manufacturing
and other work processes in order to help fund the Company's
growth strategy.
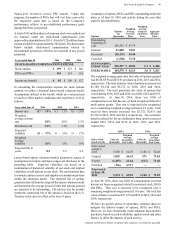
The Company expects to incur approximately $5.5 billion in
before-tax restructuring costs over a six year period (from fiscal
2012 through fiscal 2017), including costs incurred as part of
the ongoing and incremental restructuring program. The
program includes a non-manufacturing overhead enrollment
reduction target of approximately 25% - 30% by the end of
fiscal 2017.
Through fiscal 2016, the Company reduced non-
manufacturing enrollment by approximately 14,200, or
approximately 24%. The reductions are enabled by the
elimination of duplicate work, simplification through the use
of technology and optimization of various functional and
business organizations. In addition, the plan includes
integration of newly acquired companies and the optimization
of the supply chain and other manufacturing processes.
Restructuring costs incurred consist primarily of costs to
separate employees, asset-related costs to exit facilities and
other costs. The Company incurred total restructuring charges
of approximately $977 and $1,068 for the years ended June 30,
2016 and 2015, respectively. Approximately $202 and $338
of these charges were recorded in SG&A for the years ended
June 30, 2016 and 2015, respectively and approximately $718
and $614 of these charges were recorded in Cost of products
sold for the years ended June 30, 2016 and 2015, respectively.
The remainder of the charges were included in Net earnings
from discontinued operations. Since the inception of this
restructuring program, the Company has incurred
approximately $4.9 billion of the total expected restructuring
costs. Approximately $2.3 billion of these charges were related
to separations, $1.4 billion were asset-related and $1.2 billion
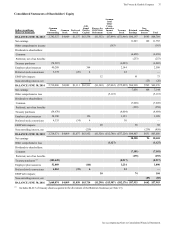
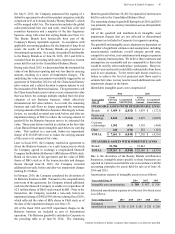
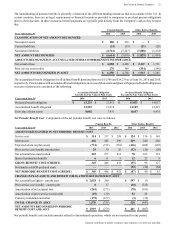
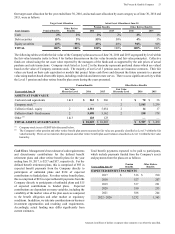
were related to other restructuring-type costs. The following
table presents restructuring activity for the years ended
June 30, 2016 and 2015:
Amounts in millions Separations
Asset-
Related
Costs Other Total
RESERVE
JUNE 30, 2014 $ 353 $ — $ 28 $ 381
Charges 516 289 263 1,068
Cash spent (507) — (264) (771)
Charges against
assets — (289) — (289)
RESERVE
JUNE 30, 2015 362 — 27 389
Charges 262 432 283 977
Cash spent (381) — (238) (619)
Charges against
assets — (432) — (432)
RESERVE
JUNE 30, 2016 $ 243 $ — $ 72 $ 315
Separation Costs
Employee separation charges for the years ended June 30, 2016
and 2015, related to severance packages for approximately
2,770 and 4,820 employees, respectively. For the years ended
June 30, 2016 and 2015, these severance packages included
approximately 920 and 2,340 non-manufacturing employees,
respectively. The packages were predominantly voluntary and
the amounts were calculated based on salary levels and past