Proctor and Gamble 2016 Annual Report Download - page 51
Download and view the complete annual report
Please find page 51 of the 2016 Proctor and Gamble annual report below. You can navigate through the pages in the report by either clicking on the pages listed below, or by using the keyword search tool below to find specific information within the annual report.-
 1
1 -
2
-
3
-
4
-
5
-
6
-
7
-
8
-
9
-
10
-
11
-
12
-
13
-
14
-
15
-
16
-
17
-
18
-
19
-
20
-
21
-
22
-
23
-
24
-
25
-
26
-
27
-
28
-
29
-
30
-
31
-
32
-
33
-
34
-
35
-
36
-
37
-
38
-
39
-
40
-
 41
41 -
 42
42 -
 43
43 -
 44
44 -
 45
45 -
 46
46 -
 47
47 -
 48
48 -
 49
49 -
 50
50 -
 51
51 -
 52
52 -
 53
53 -
 54
54 -
 55
55 -
 56
56 -
 57
57 -
 58
58 -
 59
59 -
 60
60 -
 61
61 -
62
-
63
-
64
-
65
-
66
-
67
-
68
-
69
-
70
-
71
-
72
-
73
-
74
-
75
-
76
-
77
-
78
-
79
-
80
-
81
-
82
-
83
-
84
-
85
-
86
-
87
-
88
-
89
-
90
-
91
-
92
 |
 |

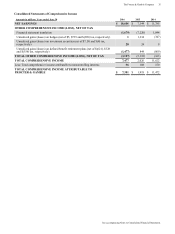
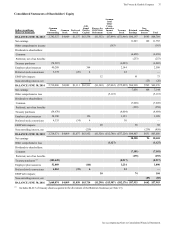
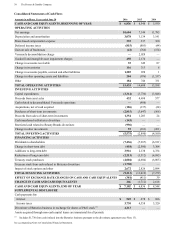
The Procter & Gamble Company 37
See accompanying Notes to Consolidated Financial Statements.
Consolidated Statements of Shareholders' Equity
Dollars in millions;
Shares in thousands
Common
Shares
Outstanding
Common
Stock
Preferred
Stock
Add-
itional
Paid-In
Capital
Reserve for
ESOP Debt
Retirement
Accumu-
lated
Other
Comp-
rehensive
Income/
(Loss)
Treasury
Stock
Retained
Earnings
Non-
controlling
Interest Total
BALANCE JUNE 30, 2013 2,742,327 $4,009 $1,137 $63,538 ($1,352) ($7,499) ($71,966) $80,197 $645 $68,709
Net earnings 11,643 142 11,785
Other comprehensive income (163) (163)
Dividends to shareholders:
Common (6,658) (6,658)
Preferred, net of tax benefits (253) (253)
Treasury purchases (74,987) (6,005) (6,005)
Employee plan issuances 40,288 364 2,144 2,508
Preferred stock conversions 3,178 (26) 4 22 —
ESOP debt impacts 12 61 73
Noncontrolling interest, net 5 (25) (20)
BALANCE JUNE 30, 2014 2,710,806 $4,009 $1,111 $63,911 ($1,340) ($7,662) ($75,805) $84,990 $762 $69,976
Net earnings 7,036 108 7,144
Other comprehensive loss (5,118) (5,118)
Dividends to shareholders:
Common (7,028) (7,028)
Preferred, net of tax benefits (259) (259)
Treasury purchases (54,670) (4,604) (4,604)
Employee plan issuances 54,100 156 3,153 3,309
Preferred stock conversions 4,335 (34) 4 30 —
ESOP debt impacts 20 68 88
Noncontrolling interest, net (219) (239) (458)
BALANCE JUNE 30, 2015 2,714,571 $4,009 $1,077 $63,852 ($1,320) ($12,780) ($77,226) $84,807 $631 $63,050
Net earnings 10,508 96 10,604
Other comprehensive loss (3,127) (3,127)
Dividends to shareholders:
Common (7,181) (7,181)
Preferred, net of tax benefits (255) (255)
Treasury purchases
(1)
(103,449) (8,217) (8,217)
Employee plan issuances 52,089 (144) 3,234 3,090
Preferred stock conversions 4,863 (39) 6 33 —
ESOP debt impacts 30 74 104
Noncontrolling interest, net (85) (85)
BALANCE JUNE 30, 2016 2,668,074 $4,009 $1,038 $63,714 ($1,290) ($15,907) ($82,176) $87,953 $642 $57,983
(1)
Includes $4,213 of treasury shares acquired in the divestiture of the Batteries business (see Note 13).