Proctor and Gamble 2016 Annual Report Download - page 35
Download and view the complete annual report
Please find page 35 of the 2016 Proctor and Gamble annual report below. You can navigate through the pages in the report by either clicking on the pages listed below, or by using the keyword search tool below to find specific information within the annual report.-
 1
1 -
2
-
3
-
4
-
5
-
6
-
7
-
8
-
9
-
10
-
11
-
12
-
13
-
14
-
15
-
16
-
17
-
18
-
19
-
20
-
21
-
22
-
23
-
24
-
 25
25 -
 26
26 -
 27
27 -
 28
28 -
 29
29 -
 30
30 -
 31
31 -
 32
32 -
 33
33 -
 34
34 -
 35
35 -
 36
36 -
 37
37 -
 38
38 -
 39
39 -
 40
40 -
 41
41 -
 42
42 -
 43
43 -
 44
44 -
 45
45 -
46
-
47
-
48
-
49
-
50
-
51
-
52
-
53
-
54
-
55
-
56
-
57
-
58
-
59
-
60
-
61
-
62
-
63
-
64
-
65
-
66
-
67
-
68
-
69
-
70
-
71
-
72
-
73
-
74
-
75
-
76
-
77
-
78
-
79
-
80
-
81
-
82
-
83
-
84
-
85
-
86
-
87
-
88
-
89
-
90
-
91
-
92
 |
 |

The Procter & Gamble Company 21
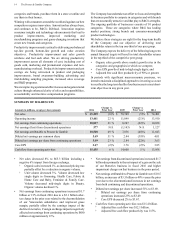
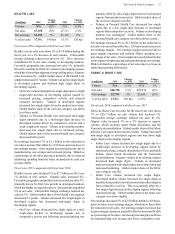
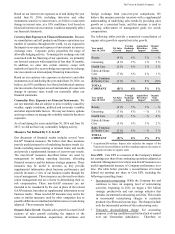
HEALTH CARE
($ millions) 2016
Change
vs. 2015 2015
Change
vs. 2014
Volume N/A (2)% N/A (1)%
Net sales $7,350 (5)% $7,713 (1)%
Net earnings $1,250 7% $1,167 8%
% of net sales 17.0% 190 bps 15.1% 120 bps
Fiscal year 2016 compared with fiscal year 2015
Health Care net sales were down 5% to $7.4 billion during the
fiscal year on a 2% decrease in unit volume. Unfavorable
foreign exchange reduced net sales by 6%. Price increases
contributed 2% to net sales, mainly in developing markets.
Favorable geographic mix increased net sales 1%, primarily
driven by a decline in Oral Care volume in developing regions,
which have lower than segment average selling prices. Organic
sales increased 2%. Global market share of the Health Care
segment decreased 0.7 points. Volume was up low single digits
in developed regions and declined high single digits in
developing regions.
• Oral Care volume declined low single digits due to a high
single-digit decrease in developing regions caused by
increased pricing, competitive activity and reduced
customer inventory. Volume in developed regions
increased low single digits driven by product innovation.
Global market share of the oral care category was down
less than a point.
• Volume in Personal Health Care decreased mid-single
digits primarily due to a mid-single-digit decrease in
developed regions driven by competitive activity and a
weak cough/cold season. Volume in developing markets
decreased low single digits due to increased pricing.
Global market share of the personal health care category
decreased half a point.
Net earnings increased 7% to $1.3 billion as the reduction in
net sales was more than offset by a 190 basis-point increase in
net earnings margin. Gross margin increased primarily due to
manufacturing cost savings and increased pricing. SG&A as
a percentage of net sales decreased primarily due to reduced
marketing spending from the focus on productivity and cost
savings efforts.
Fiscal year 2015 compared with fiscal year 2014
Health Care net sales declined 1% to $7.7 billion in 2015 on a
1% decline in unit volume. Organic sales increased 4%.
Favorable geographic and product mix increased net sales 3%,
primarily driven by Oral Care growth in developed markets,
which has higher average sales prices. Increased pricing added
2% to net sales. Unfavorable foreign exchange reduced net
sales by 5%. Global market share of the Health Care segment
decreased 0.3 points. Volume increased low single digits in
developed regions but decreased mid-single digits in
developing regions.
• Oral Care volume decreased low single digits as a mid-
single-digit decline in developing regions due to
competitive activity and following increased pricing was
partially offset by a low single-digit increase in developed
regions from product innovation. Global market share of
the oral care category was flat.
• Volume in Personal Health Care decreased low single
digits due to a low single-digit decrease in developed
regions from competitive activity. Volume in developing
markets was unchanged. Global market share of the
personal health care category was down about a point.
Net earnings increased 8% to $1.2 billion as the reduction in
net sales was more than offset by a 120 basis-point increase in
net earnings margin. Net earnings margin increased due to
gross margin expansion and reduced SG&A spending as a
percentage of net sales. Gross margin increased primarily due
to the impact of higher pricing and manufacturing cost savings.
SG&A declined as a percentage of net sales due to a focus on
marketing spending efficiencies.
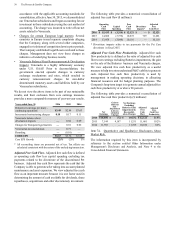
FABRIC & HOME CARE
($ millions) 2016
Change
vs. 2015 2015
Change
vs. 2014
Volume N/A (1)% N/A 1%
Net sales $20,730 (7)% $22,274 (5)%
Net earnings $2,778 5% $2,634 (5)%
% of net sales 13.4% 160 bps 11.8% —
Fiscal year 2016 compared with fiscal year 2015
Fabric & Home Care net sales for the fiscal year were down
7% to $20.7 billion on unit volume that declined 1%.
Unfavorable foreign exchange reduced net sales by 6%.
Organic sales increased 1% on a 1% increase in organic
volume, which excludes minor brand divestitures and the
Venezuela deconsolidation. Global market share of the Fabric
& Home Care segment decreased 0.2 points. Volume increased
mid-single digits in developed regions and was down high
single digits in developing regions.
• Fabric Care volume declined low single digits due to a
double-digit decrease in developing regions driven by
increased pricing, reduced distribution of less profitable
brands, minor brand divestitures and the Venezuela
deconsolidation. Organic volume in developing regions
decreased high single digits. Volume in developed
markets increased mid-single digits due to innovation and
increased marketing. Global market share of the fabric
care category was flat.
• Home Care volume increased low single digits.
Developed market volume increased low single digits as
benefits from product innovation more than offset impacts
from competitive activity. This was partially offset by a
low single-digit decrease in developing regions following
increased pricing. Global market share of the home care
category was down slightly.
Net earnings increased 5% to $2.8 billion behind a 160 basis-
point increase in net earnings margin, which more than offset
the reduction in net sales. Net earnings margin increased due
to gross margin expansion, partially offset by increased SG&A
as a percentage of net sales. Increased gross margin was driven
by manufacturing cost savings and lower commodity costs.