Proctor and Gamble 2016 Annual Report Download
Download and view the complete annual report
Please find the complete 2016 Proctor and Gamble annual report below. You can navigate through the pages in the report by either clicking on the pages listed below, or by using the keyword search tool below to find specific information within the annual report.-
 1
1 -
 2
2 -
 3
3 -
 4
4 -
 5
5 -
 6
6 -
 7
7 -
 8
8 -
 9
9 -
 10
10 -
 11
11 -
 12
12 -
13
-
14
-
15
-
16
-
17
-
18
-
19
-
20
-
21
-
22
-
23
-
24
-
25
-
26
-
27
-
28
-
29
-
30
-
31
-
32
-
33
-
34
-
35
-
36
-
37
-
38
-
39
-
40
-
41
-
42
-
43
-
44
-
45
-
46
-
47
-
48
-
49
-
50
-
51
-
52
-
53
-
54
-
55
-
56
-
57
-
58
-
59
-
60
-
61
-
62
-
63
-
64
-
65
-
66
-
67
-
68
-
69
-
70
-
71
-
72
-
73
-
74
-
75
-
76
-
77
-
78
-
79
-
80
-
81
-
82
-
83
-
84
-
85
-
86
-
87
-
88
-
89
-
90
-
91
-
92
 |
 |

P&G 2016
Annual Report
Table of contents
-
Page 1
P&G 2016 Annual Report -
Page 2
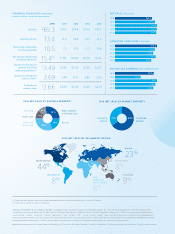
... ARNINGS (PER COMMON SHARE) 2016 2015 2014 2013 2012 $2.44 $4.01 $3.86 $3.66 $3.69 2016 NET SALES BY BUSINESS SEGMENT (2) 2016 NET SALES BY MARKET MATURIT Y Grooming Health Care Fabric and Home Care 11% 11% 28% Baby, Feminine and Family Care Developing Markets 35% 65% Developed Markets 18% 32... -
Page 3
... top-line growth rates in several key markets. We delivered another strong year of productivity improvement and cost savings. We made significant steps in our portfolio transformation - completing the Duracell transaction in February, negotiating and preparing for the sale of 41 beauty brands to... -
Page 4
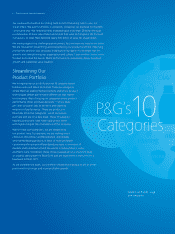
...consumer jobs to be done and objective measures of performance. These are products in financially attractive categories, which consumers purchase and use on a daily basis. These 10 categorybased business units have historically grown faster with higher margins than the balance of the company. Within... -
Page 5
... than our best competitors, in every category and every country where we choose to compete - creating superior shareholder value in the process. We're organizing our portfolio around 10 category-based business units and about 65 brands. These are categories where P&G has leading market positions and... -
Page 6
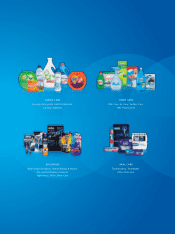
FABRIC C ARE HOME C ARE Laundry Detergents, Fabric Enhancers, Laundry Additives Dish Care, Air Care, Surface Care, P&G Professional GROOMING OR AL C ARE Male Blades & Razors, Female Blades & Razors, Pre- and Post-Shave Products, Appliances, Other Shave Care Toothbrushes, Toothpaste, Other ... -
Page 7
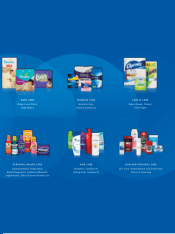
... Care, Adult Incontinence Paper Towels, Tissues, Toilet Paper PERSONAL HE ALTH C ARE HAIR C ARE SKIN AND PERSONAL C ARE Gastrointestinal, Respiratory, Rapid Diagnostics, Vitamins / Minerals / Supplements, Other Personal Health Care Shampoo, Conditioner, Styling Aids, Treatments Skin Care... -
Page 8
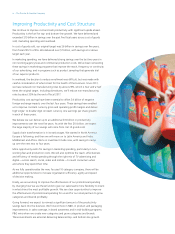
... spending, we have delivered strong savings over the last two years in non-working agency fees and commercial production costs. We've been reinvesting these savings in marketing programs that improve the reach, frequency or continuity of our advertising, and in programs such as product sampling... -
Page 9
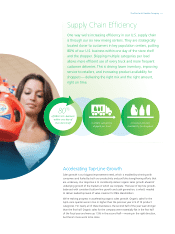
... & Gamble Company • v Supply Chain Efï¬ciency One way we're increasing efficiency in our U.S. supply chain is through our six new mixing centers. They are strategically located closer to customers in key population centers, putting 80% of our U.S. business within one day of the store shelf... -
Page 10
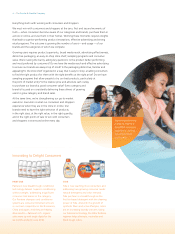
... find the right product for them with the right benefits at the right price? Do we have sampling programs that allow people to try our best products, particularly at the point of market entry? Is the relative price and absolute cash outlay to purchase our brands a good consumer value? Every category... -
Page 11
... & Gamble Company • vii Growing Users for a Stronger Top Line Growing users is a key driver of balanced growth and value creation. Two of the ways we grow users of P&G brands are to offer superior-performing products to consumers and to increase consumer trial through sampling, particularly... -
Page 12
... The Procter & Gamble Company Strengthening Organization and Culture Our choices - portfolio transformation, continued productivity improvement, and reaccelerating top-line growth - are enabled by a winning organization and culture. We are adjusting our talent development and assignment planning to... -
Page 13
... For the Fiscal Year Ended June 30, 2016 [] OR TRANSITION REPORT PURSUANT TO SECTION 13 OR 15(d) OF THE SECURITIES EXCHANGE ACT OF 1934 For the transition period from Commission File No. 1-434 to (Mark one) THE PROCTER & GAMBLE COMPANY One Procter & Gamble Plaza, Cincinnati, Ohio 45202 Telephone... -
Page 14
...Accounting Policies Note 2: Segment Information Note 3: Supplemental Financial Information Note 4: Goodwill and Intangible Assets Note 5: Income Taxes Note 6: Earnings Per Share Note 7: Stock-based Compensation Note 8: Postretirement Benefits and Employee Stock Ownership Plan Note 9: Risk Management... -
Page 15
...The Company'sAnnual Report on Form 10-K, quarterly reports on Form 10-Q and current reports on Form 8-K, and amendments thereto, are filed electronically with the SEC. The SEC maintains an internet site that contains these reports at: www.sec.gov. You can also access these reports through links from... -
Page 16
... as our business outlook and objectives in this Form 10-K, quarterly reports, press releases and other written and oral communications. All statements, except for historical and present factual information, are "forward-looking statements" and are based on financial data and business plans available... -
Page 17
... through pricing actions, cost saving projects and sourcing decisions, while maintaining and improving margins and market share. Failure to manage these fluctuations could adversely impact our financial results. Our ability to meet our growth targets depends on successful product, marketing and... -
Page 18
... consistent with our corporate values and are designed to protect and preserve our reputation, such as social responsibility and environmental sustainability. If these programs are not executed as planned or suffer negative publicity, the Company's reputation and financial results could be adversely... -
Page 19
...adversely impact our financial results. If we are unable to continue to meet these challenges and comply with all laws, regulations and related interpretations, it could negatively impact our reputation and our business results. Failure to successfully manage regulatory and legal matters and resolve... -
Page 20
... well as employee departures. Failure to deliver these planned productivity improvements and cost savings, while continuing to invest in business growth, could adversely impact our financial results. Additionally, successfully executing management transitions at leadership levels of the Company and... -
Page 21
... Global Sales Officer Senior Vice President, Comptroller and Treasurer Global Product Supply Officer President - Asia Pacific Selling and Market Operations Age 58 52 52 54 56 51 59 55 54 52 59 52 54 50 56 49 54 52 59 46 First Elected to Officer Position 2013 2009 2016 2013 2016 2016 2016 2014 2012... -
Page 22
... shares that were exchanged in the Duracell transaction (see Note 13 to our Consolidated Financial Statements), notwithstanding any purchases under the Company's compensation and benefit plans. The share repurchases were authorized pursuant to a resolution issued by the Company's Board of Directors... -
Page 23
...total return of the S&P 500 Stock Index (broad market comparison) and the S&P 500 Consumer Staples Index (line of business comparison). The graph and table assume $100 was invested on June 30, 2011, and that all dividends were reinvested. Cumulative Value of $100 Investment, through June 30 Company... -
Page 24
... Company Item 6. Selected Financial Data. The information required by this item is incorporated by reference to Note 1 and Note 2 to our Consolidated Financial Statements. Financial Summary (Unaudited) Amounts in millions, except per share amounts 2016 2015 2014 2013 2012 2011 $ 65,299 Net sales... -
Page 25
... a number of financial measures that are not defined under accounting principles generally accepted in the United States of America (U.S. GAAP), including organic sales growth, core earnings per share (Core EPS), adjusted free cash flow and adjusted free cash flow productivity. Organic sales growth... -
Page 26
...Market Operations (SMOs), Global Business Services (GBS) and Corporate Functions (CF). Global Business Units Our GBUs are organized into ten product categories. Under U.S. GAAP, the GBUs underlying the ten product categories are aggregated into five reportable segments: Beauty; Grooming; Health Care... -
Page 27
...The GBS organization is responsible for providing world-class solutions at a low cost and with minimal capital investment. Corporate Functions CF provides company-level strategy and portfolio analysis, corporate accounting, treasury, tax, external relations, governance, human resources and legal, as... -
Page 28
.... Productivity improvements and cost savings are being reinvested in product and packaging improvements, brand awareness-building advertising and trial-building sampling programs, increased sales coverage and R&D programs. We are improving operational effectiveness and organizational culture through... -
Page 29
... tax treatment of international earnings. Additionally, we attempt to carefully manage our debt and currency exposure in certain countries with currency exchange, import authorization and pricing controls, such as Argentina, Egypt, Nigeria and Ukraine. Changes in government policies in these areas... -
Page 30
...and cost savings plan to reduce costs in the areas of supply chain, marketing and overhead expenses. The plan is designed to accelerate cost reductions by streamlining management decision making, manufacturing and other work processes to fund the Company's growth strategy. Net Sales Fiscal year 2016... -
Page 31
... Procter & Gamble Company 17 Fiscal year 2015 compared with fiscal year 2014 Gross margin increased 10 basis points to 47.6% of net sales in 2015. Gross margin benefited from: • a 200 basis point impact from manufacturing cost savings and • a 90 basis point benefit from higher pricing. These... -
Page 32
... charges from foreign exchange policy changes and devaluation in Venezuela, charges for certain European legal matters and incremental restructuring related to our productivity and cost savings plan. The decline was driven by reduced net sales, partially offset by minor brand divestiture gains... -
Page 33
... & Gamble Company 19 SEGMENT RESULTS Segment results reflect information on the same basis we use for internal management reporting and performance evaluation. The results of these reportable segments do not include certain non-business unit specific costs such as interest expense, investing... -
Page 34
... billion during the fiscal year on a 2% decrease in unit volume. Unfavorable foreign exchange reduced net sales by 9%. Price increases in Shave Care contributed 5% to net sales. Unfavorable product mix decreased net sales by 2% due to a higher relative mix of disposable razors, which have lower than... -
Page 35
... marketing spending from the focus on productivity and cost savings efforts. Fiscal year 2015 compared with fiscal year 2014 Health Care net sales declined 1% to $7.7 billion in 2015 on a 1% decline in unit volume. Organic sales increased 4%. Favorable geographic and product mix increased net sales... -
Page 36
... increase in unit volume. Organic sales increased 2%. Unfavorable foreign exchange reduced net sales by 6%, while pricing added 1% to net sales, mix was neutral, and minor brand divestitures had a negative impact of about 1%. Global market share of the Fabric & Home Care segment decreased 0.1 points... -
Page 37
... by gains on minor brand divestitures. Productivity and Cost Savings Plan In 2012, the Company initiated a productivity and cost savings plan to reduce costs and better leverage scale in the areas of supply chain, research and development, marketing and overheads. The plan was designed to accelerate... -
Page 38
... to changes in customer terms and improved collection results. The number of days sales outstanding decreased 5 days due to foreign exchange impacts and improvements in collection results and customer terms. • Lower inventory generated $313 million of cash mainly due to supply chain optimizations... -
Page 39
... long-term credit ratings were Aa3 (Moody's) and AA- (Standard & Poor's), all with a stable outlook. We maintain bank credit facilities to support our ongoing commercial paper program. The current facility is an $8.0 billion facility split between a $3.2 billion five-year facility and a $4.8 billion... -
Page 40
...the normal course of business. Commitments made under take-or-pay obligations represent future purchases in line with expected usage to obtain favorable pricing. This includes service contracts for information technology, human resources management and facilities management activities that have been... -
Page 41
...of health care and life insurance for retirees. For accounting purposes, the defined benefit pension and OPEB plans require assumptions to estimate the projected and accumulated benefit obligations, including the following variables: discount rate; expected salary increases; certain employee-related... -
Page 42
...9 to the Consolidated Financial Statements for a discussion of our accounting policies for derivative instruments. Derivative positions are monitored using techniques including market valuation, sensitivity analysis and value-at-risk modeling. The tests for interest rate, currency rate and commodity... -
Page 43
... of underlying sales trends by providing sales growth on a consistent basis, and this measure is used in assessing achievement of management goals for at-risk compensation. The following tables provide a numerical reconciliation of organic sales growth to reported net sales growth: Year ended June... -
Page 44
... account planned maintenance and asset expansion. We view adjusted free cash flow as an important measure because it is one factor used in determining the amount of cash available for dividends, share repurchases, acquisitions and other discretionary investment. Management's Disclosure and Analysis... -
Page 45
... is responsible for evaluating disclosure implications of significant business activities and events, our Board of Directors, which provides strong and effective corporate governance, and our Audit Committee, which reviews significant accounting policies, financial reporting and internal control... -
Page 46
... Oversight Board (United States), the Company's internal control over financial reporting as of June 30, 2016, based on the criteria established in Internal Control Integrated Framework (2013) issued by the Committee of Sponsoring Organizations of the Treadway Commission and our report dated August... -
Page 47
... (2013) issued by the Committee of Sponsoring Organizations of the Treadway Commission. The Company's management is responsible for maintaining effective internal control over financial reporting and for its assessment of the effectiveness of internal control over financial reporting, included... -
Page 48
34 The Procter & Gamble Company Consolidated Statements of Earnings Amounts in millions except per share amounts; Years ended June 30 2016 2015 2014 NET SALES Cost of products sold Selling, general and administrative expense Venezuela deconsolidation charge OPERATING INCOME Interest expense ... -
Page 49
...) on hedges (net of $5, $739 and $(209) tax, respectively) Unrealized gains/(losses) on investment securities (net of $7, $0 and $(4) tax, respectively) Unrealized gains/(losses) on defined benefit retirement plans (net of $(621), $328 and $(356) tax, respectively) TOTAL OTHER COMPREHENSIVE INCOME... -
Page 50
... Current assets held for sale TOTAL CURRENT ASSETS PROPERTY, PLANT AND EQUIPMENT, NET GOODWILL TRADEMARKS AND OTHER INTANGIBLE ASSETS, NET NONCURRENT ASSETS HELD FOR SALE OTHER NONCURRENT ASSETS TOTAL ASSETS Liabilities and Shareholders' Equity CURRENT LIABILITIES Accounts payable Accrued and other... -
Page 51
... for ESOP Debt Retirement Treasury Stock NonRetained controlling Earnings Interest Total BALANCE JUNE 30, 2013 Net earnings Other comprehensive income Dividends to shareholders: Common Preferred, net of tax benefits Treasury purchases Employee plan issuances Preferred stock conversions ESOP debt... -
Page 52
... ACTIVITIES Dividends to shareholders Change in short-term debt Additions to long-term debt Reductions of long-term debt Treasury stock purchases Treasury stock from cash infused in Batteries divestiture Impact of stock options and other TOTAL FINANCING ACTIVITIES EFFECT OF EXCHANGE RATE CHANGES ON... -
Page 53
... in the list price to the customer. Our policy is to recognize revenue when title to the product, ownership and risk of loss transfer to the customer, which can be on the date of shipment or the date of receipt by the customer. A provision for payment discounts and product return allowances is... -
Page 54
.... Those assets are evaluated annually for impairment. We evaluate a number of factors to determine whether an indefinite life is appropriate, including the competitive environment, market share, brand history, product life cycles, operating plans and the macroeconomic environment of the countries in... -
Page 55
... fair values of long-term debt and financial instruments are disclosed in Note 9. New Accounting Pronouncements and Policies In May 2014, the FASB issued ASU 2014-09, "Revenue from Contracts with Customers (Topic 606)". This guidance outlines a single, comprehensive model for accounting for revenue... -
Page 56
...business units are comprised of similar product categories. Nine business units individually accounted for 5% or more of consolidated net sales as follows: % of Sales by Business Unit* Years ended June 30 2016 2015 2014 Fabric Care Baby Care Hair Care Home Care Shave Care Family Care Oral Care Skin... -
Page 57
... $250 to $500 annually. In fiscal 2012, the Company initiated an incremental restructuring program as part of a productivity and cost savings plan to reduce costs in the areas of supply chain, research and development, marketing and overheads. The productivity and cost savings plan was designed to... -
Page 58
... related to our Sales and Market Operations, Global Business Services and Corporate Functions activities and costs related to discontinued operations from our Batteries and Beauty Brands businesses. The change in the net carrying amount of goodwill by reportable segment was as follows: Health Care... -
Page 59
... the Batteries business via a split transaction in which the Company agreed to exchange a recapitalized Duracell Company for Berkshire Hathaway's (BH) shares of P&G stock. Based on the terms of the agreement and the value of BH's shares of P&G stock as of the transaction date and changes thereto... -
Page 60
... June 30, 2016. This primarily relates to the impact of certain adjustments to pension obligations recorded in stockholders' equity and the impact of excess tax benefits from the exercise of stock options. Tax costs charged to shareholders' equity totaled $634 for the year ended June 30, 2015. This... -
Page 61
... Pension and postretirement benefits $ 2,226 $ 1,739 1,077 Loss and other carryforwards 1,014 845 Stock-based compensation 949 515 Advance payments 281 240 Accrued marketing and promotion 266 Unrealized loss on financial and 122 foreign exchange transactions 183 216 Fixed assets 139 61 Inventory... -
Page 62
...based compensation plans under which we annually grant stock option, restricted stock unit (RSU) and performance stock unit (PSU) awards to key managers and directors. Exercise prices on options granted have been, and continue to be, set equal to the market price of the underlying shares on the date... -
Page 63
... and 2014, respectively. We have no specific policy to repurchase common shares to mitigate the dilutive impact of options, RSUs and PSUs. However, we have historically made adequate discretionary purchases, based on cash availability, market trends and other factors, to offset the impacts of such... -
Page 64
... benefit retirement pension plans to certain employees. These benefits relate primarily to local plans outside the U.S. and, to a lesser extent, plans assumed in previous acquisitions covering U.S. employees. We also provide certain other retiree benefits, primarily health care and life insurance... -
Page 65
...legal requirements or financial incentives provided to companies to pre-fund pension obligations prior to their due date. In these instances, benefit payments are typically paid directly from the Company's cash as they become due. Pension Benefits Years ended June 30 2016 2015 Other Retiree Benefits... -
Page 66
... rates of return obtained from pension investment consultants. The expected long-term rates of return for plan assets are 8 - 9% for equities and 5 - 6% for bonds. For other retiree benefit plans, the expected long-term rate of return reflects that the assets are comprised primarily of Company stock... -
Page 67
... or models that project future cash flows and discount the future amounts to a present value using market-based observable inputs, including credit risk and interest rate curves. There was no significant activity within the Level 3 pension and other retiree benefits plan assets during the years... -
Page 68
...used to purchase Series B ESOP Convertible Class A Preferred Stock to fund a portion of retiree health care benefits. These shares, net of the ESOP's debt, are considered plan assets of the other retiree benefits plan discussed above. Debt service requirements are funded by preferred stock dividends... -
Page 69
... the year. Our fair value estimates take into consideration the credit risk of both the Company and our counterparties. When active market quotes are not available for financial assets and liabilities, we use industry standard valuation models. Where applicable, these models project future cash... -
Page 70
...sets forth the Company's financial assets as of June 30, 2016 and 2015 that were measured at fair value on a recurring basis during the period: Fair Value Asset Years ended June 30 2016 2015 Investments: U.S. government securities Corporate bond securities Other investments TOTAL $ $ 4,839 1,407... -
Page 71
... the next five fiscal years are as follows: Years ending June 30 2017 2018 2019 2020 2021 Debt maturities $2,760 $1,323 $2,357 $2,099 $1,387 The Procter & Gamble Company fully and unconditionally guarantees the registered debt and securities issued by its 100% owned finance subsidiaries. Amounts... -
Page 72
...including the reclassifications out of Accumulated other comprehensive income/(loss) by component: Changes in Accumulated Other Comprehensive Income/(Loss) by Component Hedges Investment Securities Pension and Other Retiree Benefits Financial Statement Translation Total BALANCE at JUNE 30, 2014 OCI... -
Page 73
...$ 129 $ 105 $ 288 Such amounts represent future purchases in line with expected usage to obtain favorable pricing. This includes purchase commitments related to service contracts for information technology, human resources management and facilities management activities that have been outsourced to... -
Page 74
... terms of the agreement, Mars acquired our branded pet care products, our manufacturing sites in the United States and the majority of the employees working in the Pet Care business. The agreement included an option for Mars to acquire the Pet Care business in several additional countries, which was... -
Page 75
... 9,636 1,543 717 2,260 The following is selected financial information included in Net earnings/(loss) from discontinued operations for the Beauty Brands: Beauty Brands Years ended June 30 2016 2015 2014 Net sales Cost of products sold Selling, general and administrative expense Intangible asset... -
Page 76
... for sale will evolve up to the closing date for normal operational changes as well as contractual adjustments including the assumption of debt, pension plan funding and other provisions. Beauty Brands Years ended June 30 2016 (1) 2015 Cash Restricted cash Accounts receivable Inventories Prepaid... -
Page 77
The Procter & Gamble Company 63 Following is selected financial information included in Net earnings/(loss) from discontinued operations for the Batteries and Pet Care businesses: Earnings Before Impairment Charges and Income Taxes Income Tax (Expense)/ Benefit Gain/(Loss) on Sale Before Income ... -
Page 78
64 The Procter & Gamble Company NOTE 14 QUARTERLY RESULTS (UNAUDITED) Quarters Ended Sep 30 Dec 31 Mar 31 Jun 30 Total Year NET SALES OPERATING INCOME GROSS MARGIN NET EARNINGS: Net earnings from continuing operations Net earnings/(loss) from discontinued operations 2015-2016 2014-2015 2015-2016... -
Page 79
...materially affected, or are reasonably likely to materially affect, the Company's internal control over financial reporting. Item 9B. Other Information. Not applicable. PART III Item 10. Directors, Executive Officers and Corporate Governance. The Board of Directors has determined that the following... -
Page 80
... Gillette Company 2004 Long-Term Incentive Plan; The Procter & Gamble 2009 Stock and Incentive Compensation Plan; The Procter & Gamble 2013 Non-Employee Directors' Stock Plan; and The Procter & Gamble 2014 Stock and Incentive Compensation Plan. Plan Category (a) Number of securities to be issued... -
Page 81
..., non-employee members of the Gillette Board of Directors. Under the plan, eligible participants are: (i) granted or offered the right to purchase stock options, (ii) granted stock appreciation rights and/or (iii) granted shares of the Company's common stock or restricted stock units (and dividend... -
Page 82
... of the Company's Form 10-Q for the quarter ended September 30, 2012).* The Gillette Company Executive Life Insurance Program (Incorporated by reference to Exhibit (10-15) of the Company's Annual Report on Form 10-K for the year ended June 30, 2012).* The Gillette Company Personal Financial Planning... -
Page 83
The Procter & Gamble Company 69 (10-19) (10-20) - Senior Executive Recoupment Policy (Incorporated by reference to Exhibit (10-20) of the Company's Annual Report on Form 10-K for the year ended June 30, 2012).* The Gillette Company Deferred Compensation Plan (for salary deferrals prior to January... -
Page 84
... in the city of Cincinnati, State of Ohio. THE PROCTER & GAMBLE COMPANY By /s/ DAVID S. TAYLOR (David S. Taylor) Chairman of the Board, President and Chief Executive Officer August 9, 2016 Pursuant to the requirements of the Securities Exchange Act of 1934, this report has been signed below by the... -
Page 85
... of the Company's Form 10-Q for the quarter ended September 30, 2012). The Gillette Company Executive Life Insurance Program (Incorporated by reference to Exhibit (10-15) of the Company's Annual Report on Form 10-K for the year ended June 30, 2012). The Gillette Company Personal Financial Planning... -
Page 86
72 The Procter & Gamble Company (10-19) (10-20) - Senior Executive Recoupment Policy (Incorporated by reference to Exhibit (10-20) of the Company's Annual Report on Form 10-K for the year ended June 30, 2012). The Gillette Company Deferred Compensation Plan (for salary deferrals prior to January ... -
Page 87
... more, please visit www.pg.com. CORPOR ATE HEADQUARTERS New York Stock Exchange NYSE Euronext-Paris STOCK SYMBOL The Procter & Gamble Company P.O. Box 599 Cincinnati, OH 45201-0599 P&G DIRECT STOCK PURCHASE PL AN Did you know that you can give P&G stock to your children, grandchildren, nieces... -
Page 88
...Latin America Matthew Price President - Greater China Mohamed Samir President - India, Middle East and Africa Magesvaran Suranjan President - Asia Pacific Carolyn M. Tastad Group President - North America BUSINESS UNITS Steven D. Bishop Group President - Global Health Care Giovanni Ciserani Group... -
Page 89
... a Director of International Business Machines Corporation. Age 67. Lead Director, Chair of the Compensation & Leadership Development Committee and member of the Governance & Public Responsibility Committee. David S. Taylor Chairman of the Board, President and Chief Executive Officer of the Company... -
Page 90
... partnerships, respecting human and labor rights, and sourcing responsibly. • Scored a perfect 100 on the Human Rights Campaign Foundation 2016 Corporate Equality Index • Named a Supply Chain Master by the Gartner Supply Chain Top 25 • Working Mother Best Companies for Multicultural Women... -
Page 91
... diversity and inclusion as a business strategy - and an undeniable way to win. The paper utilized in the printing of this annual report is certified to the FSC® Standards, which promotes environmentally appropriate, socially beneficial and economically viable management of the world's forests. -
Page 92
© 2016 Procter & Gamble 00387131