Pottery Barn 2007 Annual Report Download - page 71
Download and view the complete annual report
Please find page 71 of the 2007 Pottery Barn annual report below. You can navigate through the pages in the report by either clicking on the pages listed below, or by using the keyword search tool below to find specific information within the annual report.-
 1
1 -
2
-
3
-
4
-
5
-
6
-
7
-
8
-
9
-
10
-
11
-
12
-
13
-
14
-
15
-
16
-
17
-
18
-
19
-
20
-
21
-
22
-
23
-
24
-
25
-
26
-
27
-
28
-
29
-
30
-
31
-
32
-
33
-
34
-
35
-
36
-
37
-
38
-
39
-
40
-
41
-
42
-
43
-
44
-
45
-
46
-
47
-
48
-
49
-
50
-
51
-
52
-
53
-
54
-
55
-
56
-
57
-
58
-
59
-
60
-
 61
61 -
 62
62 -
 63
63 -
 64
64 -
 65
65 -
 66
66 -
 67
67 -
 68
68 -
 69
69 -
 70
70 -
 71
71 -
 72
72 -
 73
73 -
 74
74 -
 75
75 -
 76
76 -
 77
77 -
 78
78 -
 79
79 -
 80
80 -
 81
81 -
82
-
83
-
84
-
85
-
86
-
87
-
88
-
89
-
90
-
91
-
92
-
93
-
94
-
95
-
96
-
97
-
98
-
99
-
100
-
101
-
102
-
103
-
104
-
105
-
106
-
107
-
108
-
109
-
110
-
111
-
112
-
113
-
114
-
115
-
116
-
117
-
118
-
119
-
120
-
121
-
122
-
123
-
124
-
125
-
126
-
127
-
128
-
129
-
130
-
131
-
132
-
133
-
134
-
135
-
136
-
137
-
138
-
139
-
140
-
141
-
142
-
143
-
144
-
145
-
146
-
147
-
148
-
149
-
150
-
151
-
152
-
153
-
154
-
155
-
156
-
157
-
158
-
159
-
160
 |
 |

similar products through our seven direct-mail catalogs (Williams-Sonoma, Pottery Barn, Pottery Barn Kids,
Pottery Barn Bed and Bath, PBteen, West Elm and Williams-Sonoma Home) and six e-commerce websites
(williams-sonoma.com, potterybarn.com, potterybarnkids.com, pbteen.com, westelm.com and wshome.com).
Management’s expectation is that the overall economics of each of our major concepts within each reportable
segment will be similar over time.
These reportable segments are strategic business units that offer similar home-centered products. They are
managed separately because the business units utilize two distinct distribution and marketing strategies. It is not
practicable for us to report revenue by product group.
We use earnings before unallocated corporate overhead, interest and taxes to evaluate segment profitability.
Unallocated costs before income taxes include corporate employee-related costs, occupancy expenses (including
depreciation expense), third-party service costs and administrative costs, primarily in our corporate systems,
corporate facilities and other administrative departments. Unallocated assets include corporate cash and cash
equivalents, the net book value of corporate facilities and related information systems, deferred income taxes and
other corporate long-lived assets.
Income tax information by segment has not been included as taxes are calculated at a company-wide level and
are not allocated to each segment.
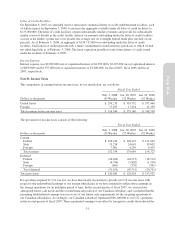
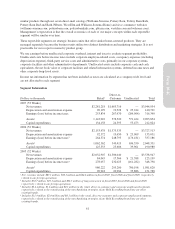
Segment Information
Dollars in thousands Retail1
Direct-to-
Customer Unallocated Total
2007 (53 Weeks)
Net revenues $2,281,218 $1,663,716 — $3,944,934
Depreciation and amortization expense 96,129 19,328 $ 25,244 140,701
Earnings (loss) before income taxes 253,834 267,470 (204,964) 316,340
Assets21,143,910 378,520 571,424 2,093,854
Capital expenditures 134,158 24,393 53,473 212,024
2006 (52 Weeks)
Net revenues $2,153,978 $1,573,535 — $3,727,513
Depreciation and amortization expense 92,372 19,650 $ 23,009 135,031
Earnings (loss) before income taxes3264,574 248,793 (176,181) 337,186
Assets21,062,362 349,419 636,550 2,048,331
Capital expenditures 125,333 25,686 39,961 190,980
2005 (52 Weeks)
Net revenues $2,032,907 $1,506,040 — $3,538,947
Depreciation and amortization expense 84,045 17,566 $ 21,588 123,199
Earnings (loss) before income taxes4278,057 232,023 (161,282) 348,798
Assets2986,222 295,200 700,198 1,981,620
Capital expenditures 96,918 20,984 33,886 151,788
1Net revenues include $87.3 million, $78.1 million and $64.6 million in fiscal 2007, fiscal 2006 and fiscal 2005, respectively,
related to our foreign operations.
2Includes $30.7 million, $23.1 million and $26.5 million of long-term assets in fiscal 2007, fiscal 2006 and fiscal 2005,
respectively, related to our foreign operations.
3Includes $2.4 million, $1.6 million and $0.3 million in the retail, direct-to-customer and corporate unallocated segments,
respectively, related to the transitioning of the merchandising strategies of our Hold Everything brand into our other
existing brands.
4Includes $11.4 million, $2.0 million and $0.1 million in the retail, direct-to-customer and corporate unallocated segments,
respectively, related to the transitioning of the merchandising strategies of our Hold Everything brand into our other
existing brands.
61
Form 10-K