Pottery Barn 2007 Annual Report Download - page 37
Download and view the complete annual report
Please find page 37 of the 2007 Pottery Barn annual report below. You can navigate through the pages in the report by either clicking on the pages listed below, or by using the keyword search tool below to find specific information within the annual report.-
 1
1 -
2
-
3
-
4
-
5
-
6
-
7
-
8
-
9
-
10
-
11
-
12
-
13
-
14
-
15
-
16
-
17
-
18
-
19
-
20
-
21
-
22
-
23
-
24
-
25
-
26
-
 27
27 -
 28
28 -
 29
29 -
 30
30 -
 31
31 -
 32
32 -
 33
33 -
 34
34 -
 35
35 -
 36
36 -
 37
37 -
 38
38 -
 39
39 -
 40
40 -
 41
41 -
 42
42 -
 43
43 -
 44
44 -
 45
45 -
 46
46 -
 47
47 -
48
-
49
-
50
-
51
-
52
-
53
-
54
-
55
-
56
-
57
-
58
-
59
-
60
-
61
-
62
-
63
-
64
-
65
-
66
-
67
-
68
-
69
-
70
-
71
-
72
-
73
-
74
-
75
-
76
-
77
-
78
-
79
-
80
-
81
-
82
-
83
-
84
-
85
-
86
-
87
-
88
-
89
-
90
-
91
-
92
-
93
-
94
-
95
-
96
-
97
-
98
-
99
-
100
-
101
-
102
-
103
-
104
-
105
-
106
-
107
-
108
-
109
-
110
-
111
-
112
-
113
-
114
-
115
-
116
-
117
-
118
-
119
-
120
-
121
-
122
-
123
-
124
-
125
-
126
-
127
-
128
-
129
-
130
-
131
-
132
-
133
-
134
-
135
-
136
-
137
-
138
-
139
-
140
-
141
-
142
-
143
-
144
-
145
-
146
-
147
-
148
-
149
-
150
-
151
-
152
-
153
-
154
-
155
-
156
-
157
-
158
-
159
-
160
 |
 |

In the direct-to-customer channel, cost of goods sold as a percentage of direct-to-customer net revenues
decreased by 30 basis points during fiscal 2006 compared to fiscal 2005. This was primarily due to an
improvement in cost of merchandise, partially offset by an increase in other occupancy expenses compared to
fiscal 2005 and higher direct-to-customer shipping costs.
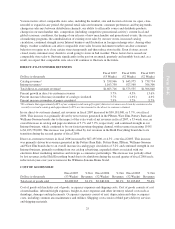
SELLING, GENERAL AND ADMINISTRATIVE EXPENSES
Dollars in thousands
Fiscal 2007
(53 Weeks)
% Net
Revenues
Fiscal 2006
(52 Weeks)
% Net
Revenues
Fiscal 2005
(52 Weeks)
% Net
Revenues
Selling, general and administrative expenses $1,222,573 31.0% $1,159,786 31.1% $1,090,392 30.8%
Selling, general and administrative expenses consist of non-occupancy related costs associated with our retail
stores, distribution warehouses, customer care centers, supply chain operations (buying, receiving and
inspection), and corporate administrative functions. These costs include employment, advertising, third party
credit card processing and other general expenses.
Due to their distinct distribution and marketing strategies, we experience differing employment and advertising
costs as a percentage of net revenues within the retail and direct-to-customer channels. Store employment costs
represent a greater percentage of retail net revenues than employment costs as a percentage of net revenues
within the direct-to-customer channel. However, catalog advertising expenses are greater within the
direct-to-customer channel than the retail channel.
Fiscal 2007 vs. Fiscal 2006
Selling, general and administrative expenses increased by $62,787,000, or 5.4%, over fiscal 2006. Selling,
general and administrative expenses as a percentage of net revenues decreased to 31.0% in fiscal 2007 from
31.1% in fiscal 2006. This 10 basis point decrease as a percentage of net revenues was primarily driven by
certain asset disposal and asset impairment costs incurred in fiscal 2006 that did not recur in fiscal 2007 and
lower advertising costs due to a higher percentage of direct-to-customer revenues being generated in the Internet
channel, which operates at a lower advertising cost than the catalog. Partially offsetting this favorability,
however, were increased employment costs, primarily driven by higher incentive compensation, as well as an
$8,600,000 net benefit recorded in fiscal 2006, that did not recur in fiscal 2007, from “Unusual Business Events”
(unredeemed gift certificate income due to a change in estimate and the Visa/MasterCard litigation settlement
income, partially offset by the expense associated with the departure of our Chief Executive Officer and the
expense associated with the Hold Everything transition).
In the retail channel, selling, general and administrative expenses as a percentage of retail net revenues decreased
approximately 30 basis points in fiscal 2007 versus fiscal 2006. This decrease as a percentage of net revenues
was primarily driven by retail asset impairment charges recorded in fiscal 2006 that did not recur in fiscal 2007
and increased income from unredeemed gift certificates and gift cards, partially offset by increased employment
costs primarily associated with the growth of the emerging brands.
In the direct-to-customer channel, selling, general and administrative expenses as a percentage of
direct-to-customer net revenues decreased by approximately 60 basis points in fiscal 2007 compared to fiscal
2006. This was primarily driven by lower advertising costs due to a higher percentage of direct-to-customer
revenues being generated in the Internet channel, which operates at a lower advertising cost than the catalog, a
reduction in other general expenses and increased income from unredeemed gift certificates.
Fiscal 2006 vs. Fiscal 2005
Selling, general and administrative expenses increased by $69,394,000, or 6.4%, over fiscal 2005. Including the
charge of approximately $16,000,000 resulting from both the expense associated with stock-based compensation
(including the implementation of SFAS 123R) and the favorable net impact of Unusual Business Events, selling,
general and administrative expenses as a percentage of net revenues increased to 31.1% in fiscal 2006 from
30.8% in fiscal 2005. This 30 basis point increase as a percentage of net revenues was primarily driven by
increased employment costs due to the recognition of stock-based compensation expense, the growth of the
27
Form 10-K