Pottery Barn 2007 Annual Report Download - page 68
Download and view the complete annual report
Please find page 68 of the 2007 Pottery Barn annual report below. You can navigate through the pages in the report by either clicking on the pages listed below, or by using the keyword search tool below to find specific information within the annual report.-
 1
1 -
2
-
3
-
4
-
5
-
6
-
7
-
8
-
9
-
10
-
11
-
12
-
13
-
14
-
15
-
16
-
17
-
18
-
19
-
20
-
21
-
22
-
23
-
24
-
25
-
26
-
27
-
28
-
29
-
30
-
31
-
32
-
33
-
34
-
35
-
36
-
37
-
38
-
39
-
40
-
41
-
42
-
43
-
44
-
45
-
46
-
47
-
48
-
49
-
50
-
51
-
52
-
53
-
54
-
55
-
56
-
57
-
 58
58 -
 59
59 -
 60
60 -
 61
61 -
 62
62 -
 63
63 -
 64
64 -
 65
65 -
 66
66 -
 67
67 -
 68
68 -
 69
69 -
 70
70 -
 71
71 -
 72
72 -
 73
73 -
 74
74 -
 75
75 -
 76
76 -
 77
77 -
 78
78 -
79
-
80
-
81
-
82
-
83
-
84
-
85
-
86
-
87
-
88
-
89
-
90
-
91
-
92
-
93
-
94
-
95
-
96
-
97
-
98
-
99
-
100
-
101
-
102
-
103
-
104
-
105
-
106
-
107
-
108
-
109
-
110
-
111
-
112
-
113
-
114
-
115
-
116
-
117
-
118
-
119
-
120
-
121
-
122
-
123
-
124
-
125
-
126
-
127
-
128
-
129
-
130
-
131
-
132
-
133
-
134
-
135
-
136
-
137
-
138
-
139
-
140
-
141
-
142
-
143
-
144
-
145
-
146
-
147
-
148
-
149
-
150
-
151
-
152
-
153
-
154
-
155
-
156
-
157
-
158
-
159
-
160
 |
 |

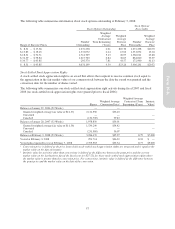
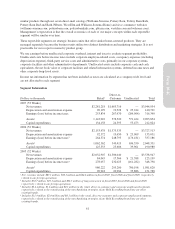
The following table summarizes information about stock-settled stock appreciation rights outstanding at
February 3, 2008:
Stock-Settled
Stock Appreciation
Rights Outstanding
Stock-Settled
Stock Appreciation
Rights Vested
Range of Conversion Prices
Number
Outstanding
Weighted
Average
Contractual
Term Remaining
(Years)
Weighted
Average
Conversion
Price
Number
Vested
Weighted
Average
Conversion
Price
$ 27.14 – $ 33.07 685,690 8.82 $30.47 110,200 $30.56
$ 33.41 – $ 34.64 562,250 8.96 34.47 15,370 33.68
$ 34.89 – $ 34.89 1,218,850 9.14 34.89 — —
$ 36.70 – $ 39.05 30,500 8.31 38.13 6,260 38.15
$ 40.44 – $ 42.13 789,180 8.11 40.47 159,884 40.47
$ 27.14 – $ 42.13 3,286,470 8.79 $35.27 291,714 $36.32
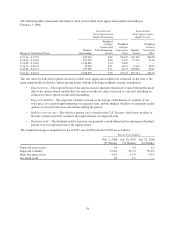
The fair value for both stock options and stock-settled stock appreciation rights was estimated on the date of the
grant using the Black-Scholes option pricing model with the following weighted-average assumptions:
•Expected term – The expected term of the option awards represents the period of time between the grant
date of the option awards and the date the option awards are either exercised or canceled, including an
estimate for those option awards still outstanding.
•Expected volatility – The expected volatility is based on an average of the historical volatility of our
stock price, for a period approximating our expected term, and the implied volatility of externally traded
options of our stock that were entered into during the period.
•Risk-free interest rate – The risk-free interest rate is based on the U.S. Treasury yield curve in effect at
the time of grant and with a maturity that approximates our expected term.
•Dividend yield – The dividend yield is based on our quarterly cash dividend and its anticipated dividend
payout over our expected term of the option award.
The weighted average assumptions for fiscal 2007, fiscal 2006 and fiscal 2005 are as follows:
Fiscal Year Ended
Feb. 3, 2008
(53 Weeks)
Jan. 28, 2007
(52 Weeks)
Jan. 29, 2006
(52 Weeks)
Expected term (years) 5.0 5.0 6.5
Expected volatility 33.6% 33.7% 59.2%
Risk-free interest rate 4.4% 4.7% 4.3%
Dividend yield 1% 1% —
58