Pottery Barn 2007 Annual Report Download - page 69
Download and view the complete annual report
Please find page 69 of the 2007 Pottery Barn annual report below. You can navigate through the pages in the report by either clicking on the pages listed below, or by using the keyword search tool below to find specific information within the annual report.-
 1
1 -
2
-
3
-
4
-
5
-
6
-
7
-
8
-
9
-
10
-
11
-
12
-
13
-
14
-
15
-
16
-
17
-
18
-
19
-
20
-
21
-
22
-
23
-
24
-
25
-
26
-
27
-
28
-
29
-
30
-
31
-
32
-
33
-
34
-
35
-
36
-
37
-
38
-
39
-
40
-
41
-
42
-
43
-
44
-
45
-
46
-
47
-
48
-
49
-
50
-
51
-
52
-
53
-
54
-
55
-
56
-
57
-
58
-
 59
59 -
 60
60 -
 61
61 -
 62
62 -
 63
63 -
 64
64 -
 65
65 -
 66
66 -
 67
67 -
 68
68 -
 69
69 -
 70
70 -
 71
71 -
 72
72 -
 73
73 -
 74
74 -
 75
75 -
 76
76 -
 77
77 -
 78
78 -
 79
79 -
80
-
81
-
82
-
83
-
84
-
85
-
86
-
87
-
88
-
89
-
90
-
91
-
92
-
93
-
94
-
95
-
96
-
97
-
98
-
99
-
100
-
101
-
102
-
103
-
104
-
105
-
106
-
107
-
108
-
109
-
110
-
111
-
112
-
113
-
114
-
115
-
116
-
117
-
118
-
119
-
120
-
121
-
122
-
123
-
124
-
125
-
126
-
127
-
128
-
129
-
130
-
131
-
132
-
133
-
134
-
135
-
136
-
137
-
138
-
139
-
140
-
141
-
142
-
143
-
144
-
145
-
146
-
147
-
148
-
149
-
150
-
151
-
152
-
153
-
154
-
155
-
156
-
157
-
158
-
159
-
160
 |
 |

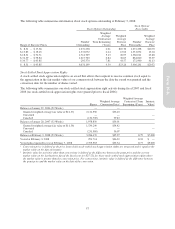
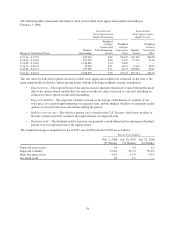
Restricted Stock Units
The following table summarizes our restricted stock unit activity during fiscal 2007, fiscal 2006 and fiscal 2005:
Weighted Average
Shares
Grant Date
Fair Value
Intrinsic
Value1
Balance at January 30, 2005 (52 Weeks) —
Granted 840,000 $42.18
Vested — — —
Canceled —
Balance at January 29, 2006 (52 Weeks) 840,000
Granted 70,000 $30.34
Vested — — —
Canceled (60,000)
Balance at January 28, 2007 (52 Weeks) 850,000
Granted 51,800 $32.71
Vested — — —
Canceled (70,000)
Balance at February 3, 2008 (53 Weeks) 831,800 $40.59 $22,891,000
Vested at February 3, 2008 — — —
Expected to Vest at February 3, 2008 762,153 $40.59 $20,974,000
1Intrinsic value for restricted stock units is defined as the market value on the last business day of the fiscal year (or $27.52).
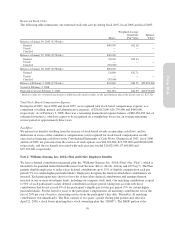
Total Stock-Based Compensation Expense
During fiscal 2007, fiscal 2006 and fiscal 2005, we recognized total stock-based compensation expense, as a
component of selling, general and administrative expenses, of $26,812,000, $26,759,000 and $440,000,
respectively. As of February 3, 2008, there was a remaining unamortized expense balance of $60,456,000 (net of
estimated forfeitures), which we expect to be recognized on a straight-line basis over an average remaining
service period of approximately three years.
Tax Effect
We present tax benefits resulting from the exercise of stock-based awards as operating cash flows, and tax
deductions in excess of the cumulative compensation cost recognized for stock-based compensation awards
exercised as financing cash flows in the Consolidated Statements of Cash Flows. During fiscal 2007, fiscal 2006
and fiscal 2005, net proceeds from the exercise of stock options was $28,362,000, $13,935,000 and $28,002,000,
respectively, and the tax benefit associated with such exercises totaled $10,821,000, $7,696,000 and
$15,743,000, respectively.
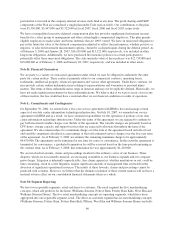
Note J: Williams-Sonoma, Inc. 401(k) Plan and Other Employee Benefits
We have a defined contribution retirement plan, the “Williams-Sonoma, Inc. 401(k) Plan” (the “Plan”), which is
intended to be qualified under Internal Revenue Code Sections 401(a), 401(k), 401(m) and 4975(e)(7). The Plan
permits eligible employees to make salary deferral contributions up to 15% of eligible compensation each pay
period (5% for certain higher paid individuals). Employees designate the funds in which their contributions are
invested. Each participant may choose to have his or her salary deferral contributions and earnings thereon
invested in one or more investment funds, including our company stock fund. Our matching contribution is equal
to 50% of each participant’s salary deferral contribution each pay period, taking into account only those
contributions that do not exceed 6% of the participant’s eligible pay for the pay period (5% for certain higher
paid individuals). For the first five years of the participant’s employment, all matching contributions vest at the
rate of 20% per year of service, measuring service from the participant’s hire date. Thereafter, all matching
contributions vest immediately. The Plan consists of two parts: a profit sharing plan portion and, effective
April 21, 2006, a stock bonus plan/employee stock ownership plan (the “ESOP”). The ESOP portion is the
59
Form 10-K