Pottery Barn 2007 Annual Report Download - page 51
Download and view the complete annual report
Please find page 51 of the 2007 Pottery Barn annual report below. You can navigate through the pages in the report by either clicking on the pages listed below, or by using the keyword search tool below to find specific information within the annual report.-
 1
1 -
2
-
3
-
4
-
5
-
6
-
7
-
8
-
9
-
10
-
11
-
12
-
13
-
14
-
15
-
16
-
17
-
18
-
19
-
20
-
21
-
22
-
23
-
24
-
25
-
26
-
27
-
28
-
29
-
30
-
31
-
32
-
33
-
34
-
35
-
36
-
37
-
38
-
39
-
40
-
 41
41 -
 42
42 -
 43
43 -
 44
44 -
 45
45 -
 46
46 -
 47
47 -
 48
48 -
 49
49 -
 50
50 -
 51
51 -
 52
52 -
 53
53 -
 54
54 -
 55
55 -
 56
56 -
 57
57 -
 58
58 -
 59
59 -
 60
60 -
 61
61 -
62
-
63
-
64
-
65
-
66
-
67
-
68
-
69
-
70
-
71
-
72
-
73
-
74
-
75
-
76
-
77
-
78
-
79
-
80
-
81
-
82
-
83
-
84
-
85
-
86
-
87
-
88
-
89
-
90
-
91
-
92
-
93
-
94
-
95
-
96
-
97
-
98
-
99
-
100
-
101
-
102
-
103
-
104
-
105
-
106
-
107
-
108
-
109
-
110
-
111
-
112
-
113
-
114
-
115
-
116
-
117
-
118
-
119
-
120
-
121
-
122
-
123
-
124
-
125
-
126
-
127
-
128
-
129
-
130
-
131
-
132
-
133
-
134
-
135
-
136
-
137
-
138
-
139
-
140
-
141
-
142
-
143
-
144
-
145
-
146
-
147
-
148
-
149
-
150
-
151
-
152
-
153
-
154
-
155
-
156
-
157
-
158
-
159
-
160
 |
 |

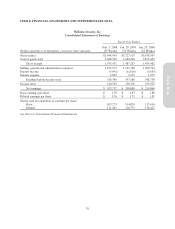
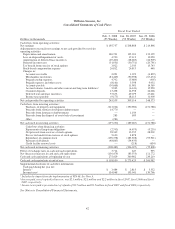
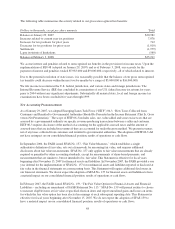
Williams-Sonoma, Inc.
Consolidated Statements of Shareholders’ Equity
Common Stock Additional
Paid-in
Capital
Retained
Earnings
Accumulated
Other
Comprehensive
Income
Total
Shareholders’
Equity
Comprehensive
IncomeDollars and shares in thousands Shares Amount
Balance at January 30, 2005 (52 Weeks) 115,372 $1,154 $286,720 $ 664,619 $ 5,169 $ 957,662
Net earnings — — — 214,866 — 214,866 $214,866
Foreign currency translation adjustment — — — — 2,526 2,526 2,526
Exercise of stock options
and related tax effect 1,829 18 43,727 — — 43,745
Repurchase and retirement
of common stock (2,422) (24) (5,741) (88,156) — (93,921)
Stock-based compensation expense — — 440 — — 440
Comprehensive income $217,392
Balance at January 29, 2006 (52 Weeks) 114,779 1,148 325,146 791,329 7,695 1,125,318
Net earnings — — — 208,868 — 208,868 $208,868
Foreign currency translation adjustment — — — — 76 76 76
Unrealized gain on investment — — — — 13 13 13
Exercise of stock options
and related tax effect 913 9 21,349 — — 21,358
Repurchase and retirement
of common stock (5,824) (58) (15,031) (170,419) — (185,508)
Stock-based compensation expense — — 26,759 54 — 26,813
Dividends declared — — — (45,507) — (45,507)
Comprehensive income $208,957
Balance at January 28, 2007 (52 Weeks) 109,868 1,099 358,223 784,325 7,784 1,151,431
Net earnings — — — 195,757 — 195,757 $195,757
Foreign currency translation adjustment — — — — 7,482 7,482 7,482
Unrealized loss on investment — — — — (15) (15) (15)
Exercise of stock options
and related tax effect 1,677 16 36,337 — — 36,353
Repurchase and retirement
of common stock (6,196) (61) (18,060) (172,257) — (190,378)
Stock-based compensation expense — — 26,717 60 — 26,777
Dividends declared — — — (50,000) — (50,000)
Adoption of FIN 48 1— — — (11,684) — (11,684)
Comprehensive income $203,224
Balance at February 3, 2008 (53 Weeks) 105,349 $1,054 $403,217 $ 746,201 $15,251 $1,165,723
1Represents the impact from the implementation of Financial Accounting Standards Board (“FASB”) Interpretation Number
(“FIN”) 48, “Accounting for Uncertainty in Income Taxes—an interpretation of FASB Statement No. 109.” See Note A.
See Notes to Consolidated Financial Statements.
41
Form 10-K