Pottery Barn 2007 Annual Report Download - page 125
Download and view the complete annual report
Please find page 125 of the 2007 Pottery Barn annual report below. You can navigate through the pages in the report by either clicking on the pages listed below, or by using the keyword search tool below to find specific information within the annual report.-
 1
1 -
2
-
3
-
4
-
5
-
6
-
7
-
8
-
9
-
10
-
11
-
12
-
13
-
14
-
15
-
16
-
17
-
18
-
19
-
20
-
21
-
22
-
23
-
24
-
25
-
26
-
27
-
28
-
29
-
30
-
31
-
32
-
33
-
34
-
35
-
36
-
37
-
38
-
39
-
40
-
41
-
42
-
43
-
44
-
45
-
46
-
47
-
48
-
49
-
50
-
51
-
52
-
53
-
54
-
55
-
56
-
57
-
58
-
59
-
60
-
61
-
62
-
63
-
64
-
65
-
66
-
67
-
68
-
69
-
70
-
71
-
72
-
73
-
74
-
75
-
76
-
77
-
78
-
79
-
80
-
81
-
82
-
83
-
84
-
85
-
86
-
87
-
88
-
89
-
90
-
91
-
92
-
93
-
94
-
95
-
96
-
97
-
98
-
99
-
100
-
101
-
102
-
103
-
104
-
105
-
106
-
107
-
108
-
109
-
110
-
111
-
112
-
113
-
114
-
 115
115 -
 116
116 -
 117
117 -
 118
118 -
 119
119 -
 120
120 -
 121
121 -
 122
122 -
 123
123 -
 124
124 -
 125
125 -
 126
126 -
 127
127 -
 128
128 -
 129
129 -
 130
130 -
 131
131 -
 132
132 -
 133
133 -
 134
134 -
 135
135 -
136
-
137
-
138
-
139
-
140
-
141
-
142
-
143
-
144
-
145
-
146
-
147
-
148
-
149
-
150
-
151
-
152
-
153
-
154
-
155
-
156
-
157
-
158
-
159
-
160
 |
 |

The Compensation Committee believes that offering the executive team a total compensation package with a
strong at-risk, pay-for-performance component helps to achieve the company’s objective of creating value for its
shareholders. Each of the three major elements in the executive compensation program is discussed in detail
below, but in general, this means:
• Base salaries are competitive compared with comparable public retail companies relative to similar
positions to create an incentive for executives to join and remain with the company;
• Annual incentive opportunities are based principally on the company’s overall corporate performance and
the executive’s attainment of individual goals. This results in the company’s strongest performers
receiving greater compensatory rewards and lesser performers receiving lower compensatory rewards.
We believe the structure of our annual incentive opportunities fosters a performance-driven,
pay-for-performance culture; and
• Long-term incentives, such as equity compensation awards, are structured to encourage our executive
team to work toward long-term sustained growth and success from the perspective of owners in the
company and to reward executives and other key employees for maximizing long-term shareholder value.
The named executive officers also receive certain retirement and other benefits, as well as perquisites and other
personal benefits. We consider these perquisites (described below), in addition to the major elements of
compensation, in determining if total compensation is reasonable and not excessive.
Does the Compensation Committee compare the company’s compensation practices to those of other companies?
The compensation practices of other companies within the retail industry are relevant to establishing the
company’s compensation programs and executive compensation for each year. Specifically, the Compensation
Committee strives to ensure that the company’s total compensation packages and executive compensation are
competitive, e.g., between the 50th and 75th percentile of our comparator group. In order to achieve such goals,
the Compensation Committee takes into account the relationships among base salary, short-term incentive
compensation and long-term equity compensation at other companies considered to be comparable each year,
collectively referred to as “comparable companies” or our “proxy peer group.” Our proxy peer group consists of
other retail companies that are “comparable” to our company in one or more significant ways: they may be
specialty retailers, they may be of similar revenue size or they may compete with us for executive talent in our
geographic markets. For fiscal 2007, the comparable companies included the following 19 public retail
companies: Abercrombie & Fitch, American Eagle Outfitters, Ann Taylor, Barnes & Noble, Bed Bath & Beyond,
Borders Group, Cost Plus, Ethan Allen Interiors, Gap, Limited Brands, Men’s Wearhouse, Nordstrom, Office
Depot, Pier 1 Imports, PetSmart, Ross Stores, Starbucks, Talbots and Tiffany & Co. Linens ‘N Things and
Michaels Stores were comparable companies in fiscal 2006 that became private companies during that year and
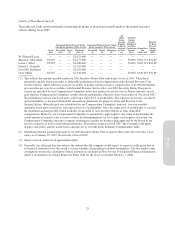
thus have been removed from the peer group. The following table, which is based on publicly available
information as of January 31, 2008 as provided by Frederic W. Cook, provides a financial overview of the
comparable companies to illustrate their revenues, income and market capitalization as a group relative to the
company. The Compensation Committee may review additional benchmarking surveys and proxy data providing
summarized data levels of base salary, target annual cash incentives, and equity-based and other long-term
incentives to assess market competitiveness of our compensation programs for our named executive officers.
Net Revenue (in millions) Net Income (in millions)
Market Capitalization
(in millions)
(as of 1/31/08)
75th Percentile ........................ $8,155 $550 $6,796
Mean ............................... $5,713 $306 $4,622
Median .............................. $3,993 $260 $3,949
25th Percentile ........................ $2,373 $101 $1,128
Williams-Sonoma, Inc. ................. $3,826 $192 $2,747
35
Proxy