Pottery Barn 2004 Annual Report Download - page 63
Download and view the complete annual report
Please find page 63 of the 2004 Pottery Barn annual report below. You can navigate through the pages in the report by either clicking on the pages listed below, or by using the keyword search tool below to find specific information within the annual report.-
 1
1 -
2
-
3
-
4
-
5
-
6
-
7
-
8
-
9
-
10
-
11
-
12
-
13
-
14
-
15
-
16
-
17
-
18
-
19
-
20
-
21
-
22
-
23
-
24
-
25
-
26
-
27
-
28
-
29
-
30
-
31
-
32
-
33
-
34
-
35
-
36
-
37
-
38
-
39
-
40
-
41
-
42
-
43
-
44
-
45
-
46
-
47
-
48
-
49
-
50
-
51
-
52
-
 53
53 -
 54
54 -
 55
55 -
 56
56 -
 57
57 -
 58
58 -
 59
59 -
 60
60 -
 61
61 -
 62
62 -
 63
63 -
 64
64 -
 65
65 -
 66
66 -
 67
67 -
 68
68 -
 69
69 -
 70
70 -
 71
71 -
 72
72 -
 73
73 -
74
-
75
-
76
-
77
-
78
-
79
-
80
-
81
-
82
-
83
-
84
-
85
-
86
-
87
-
88
-
89
-
90
-
91
-
92
-
93
-
94
-
95
-
96
-
97
-
98
-
99
-
100
-
101
-
102
-
103
-
104
-
105
-
106
-
107
-
108
-
109
-
110
-
111
-
112
-
113
-
114
-
115
-
116
 |
 |

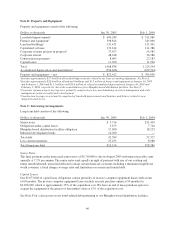
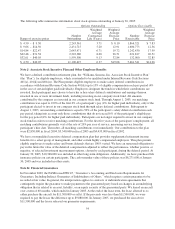
These reportable segments are strategic business units that offer similar home-centered products. They are
managed separately because the business units utilize two distinct distribution and marketing strategies. It is not
practicable for us to report revenue by product group.
We use earnings before unallocated corporate overhead, interest and taxes to evaluate segment profitability.
Unallocated costs before income taxes include corporate employee-related costs, depreciation expense, other
occupancy expense and administrative costs, primarily in our corporate systems, corporate facilities and other
administrative departments. Unallocated assets include corporate cash and cash equivalents, the net book value of
corporate facilities and related information systems, deferred income taxes and other corporate long-lived assets.
Income tax information by segment has not been included as taxes are calculated at a company-wide level and
are not allocated to each segment.
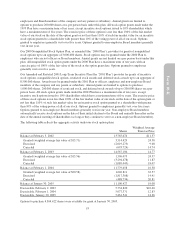
Segment Information
Dollars in thousands Retail
Direct-to-
Customer Unallocated Total
2004
Net revenues1$1,810,979 $1,325,952 — $3,136,931
Depreciation and amortization expense 76,667 16,174 $ 18,783 111,624
Earnings (loss) before income taxes 253,038 210,809 (153,642) 310,205
Assets2,3 910,924 279,579 555,042 1,745,545
Capital expenditures 90,027 40,894 50,532 181,453
2003
Net revenues1$1,622,383 $1,131,985 — $2,754,368
Depreciation and amortization expense 68,800 15,472 $ 15,262 99,534
Earnings (loss) before income taxes 231,512 172,266 (148,140) 255,638
Assets3822,340 218,603 429,792 1,470,735
Capital expenditures 121,759 11,845 78,375 211,979
2002
Net revenues1$1,423,993 $ 936,837 — $2,360,830
Depreciation and amortization expense 59,312 19,378 $ 12,794 91,484
Earnings (loss) before income taxes 214,648 140,527 (152,893) 202,282
Assets3726,199 160,714 377,542 1,264,455
Capital expenditures 112,748 6,442 36,991 156,181
1Includes $50.1 million, $42.7 million and $25.8 million in fiscal 2004, 2003 and 2002, respectively, related to our foreign
operations.
2Includes $17,100,000, $260,000 and $40,000 of leasehold improvements in the retail, direct-to-customer and unallocated
segments, respectively, related to our lease accounting adjustment. See Note E.
3Includes $23.1 million, $22.5 million and $19.1 million of long-term assets in fiscal 2004, 2003 and 2002, respectively,
related to our foreign operations.
56