Pottery Barn 2004 Annual Report Download - page 3
Download and view the complete annual report
Please find page 3 of the 2004 Pottery Barn annual report below. You can navigate through the pages in the report by either clicking on the pages listed below, or by using the keyword search tool below to find specific information within the annual report.-
 1
1 -
 2
2 -
 3
3 -
 4
4 -
 5
5 -
 6
6 -
 7
7 -
 8
8 -
 9
9 -
 10
10 -
 11
11 -
 12
12 -
 13
13 -
 14
14 -
15
-
16
-
17
-
18
-
19
-
20
-
21
-
22
-
23
-
24
-
25
-
26
-
27
-
28
-
29
-
30
-
31
-
32
-
33
-
34
-
35
-
36
-
37
-
38
-
39
-
40
-
41
-
42
-
43
-
44
-
45
-
46
-
47
-
48
-
49
-
50
-
51
-
52
-
53
-
54
-
55
-
56
-
57
-
58
-
59
-
60
-
61
-
62
-
63
-
64
-
65
-
66
-
67
-
68
-
69
-
70
-
71
-
72
-
73
-
74
-
75
-
76
-
77
-
78
-
79
-
80
-
81
-
82
-
83
-
84
-
85
-
86
-
87
-
88
-
89
-
90
-
91
-
92
-
93
-
94
-
95
-
96
-
97
-
98
-
99
-
100
-
101
-
102
-
103
-
104
-
105
-
106
-
107
-
108
-
109
-
110
-
111
-
112
-
113
-
114
-
115
-
116
 |
 |

TO OUR SHAREHOLDERS:
Fiscal year 2004 was a year of opportunity, achievement, and financial success. We broke new ground in our
emerging brands, reengineered our distribution network to better serve our customers, optimized our supply
chain to improve our operational efficiency, and delivered our fourth consecutive year of record financial results.
It was also a year highlighted by a number of strategic advancements — all of which point to our strong position
in the markets that we serve and our readiness for continued growth.
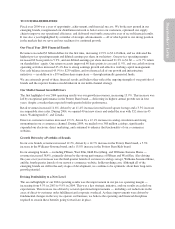
Our Fiscal Year 2004 Financial Results
Revenues exceeded $3 billion dollars for the first time, increasing 13.9% to $3.14 billion, and we delivered the
highest pre-tax operating margin and diluted earnings per share in our history. Our pre-tax operating margin
increased 60 basis points to 9.9%, and our diluted earnings per share increased 21.2% to $1.60 — a 21.7% return
on shareholders’ equity. Our return on assets improved 40 basis points to a record 11.9%, and our cash flow from
operating activities increased 45.4% due to strong earnings growth and effective working capital management.
Our cash balance increased 45.9% to $239 million, and we financed all of our growth and infrastructure
initiatives — in addition to a $79 million share repurchase — through internally generated funds.
We are extremely proud of these financial results and believe they reflect the ongoing strength of our portfolio of
brands and the superior business model inherent in our multi-channel strategy.
Our Multi-Channel Growth Drivers
The first highlight of our 2004 operating results was our growth in revenues, increasing 13.9%. This increase was
led by exceptional performance in the Pottery Barn brand — delivering its highest annual growth rate in four
years, despite a weaker than expected fourth quarter holiday performance.
Retail revenues increased 11.6%, driven by an 11.4% increase in retail leased square footage and a 3.5% increase
in comparable store sales. During 2004, we opened 40 net new stores and ended the year with 552 stores in 43
states, Washington D.C. and Canada.
Direct-to-customer revenues increased 17.1%, driven by a 12.1% increase in catalog circulation and strong
momentum in our e-commerce channel. During 2004, we mailed over 368 million catalogs, significantly
expanded our electronic direct marketing, and continued to enhance the functionality of our e-commerce
websites.
Growth Driven by a Portfolio of Brands
In our core brands, revenues increased 12.2%, driven by a 14.7% increase in the Pottery Barn brand, a 5.3%
increase in the Williams-Sonoma brand, and a 15.8% increase in the Pottery Barn Kids brand.
In our emerging brands — including PBteen, West Elm, Hold Everything, and Williams-Sonoma Home —
revenues increased 38.4%, primarily driven by the strong performance of PBteen and West Elm. Also driving
this year-over-year increase was the third quarter launch of our newest catalog concept, Williams-Sonoma Home,
and the fourth quarter launch of our newest e-commerce website, holdeverything.com. Although all of the
emerging brands are still in the early stages of development, we continue to be optimistic about their long-term
growth potential.
Driving Profitability to a New Level
The second highlight of our 2004 operating results was the improvement in our pre-tax operating margin —
increasing from 9.3% in 2003 to 9.9% in 2004. This was a key strategic initiative, and our results exceeded our
expectations. This increase was driven by several operational improvements — including cost reductions in the
areas of direct-to-customer order fulfillment and corporate overhead. As these improvements were driven by
fundamental changes in the way we operate our business, we believe the operating and financial disciplines
required to sustain these benefits going forward are in place.
Shareholders’ Letter