Pottery Barn 2004 Annual Report Download - page 51
Download and view the complete annual report
Please find page 51 of the 2004 Pottery Barn annual report below. You can navigate through the pages in the report by either clicking on the pages listed below, or by using the keyword search tool below to find specific information within the annual report.-
 1
1 -
2
-
3
-
4
-
5
-
6
-
7
-
8
-
9
-
10
-
11
-
12
-
13
-
14
-
15
-
16
-
17
-
18
-
19
-
20
-
21
-
22
-
23
-
24
-
25
-
26
-
27
-
28
-
29
-
30
-
31
-
32
-
33
-
34
-
35
-
36
-
37
-
38
-
39
-
40
-
 41
41 -
 42
42 -
 43
43 -
 44
44 -
 45
45 -
 46
46 -
 47
47 -
 48
48 -
 49
49 -
 50
50 -
 51
51 -
 52
52 -
 53
53 -
 54
54 -
 55
55 -
 56
56 -
 57
57 -
 58
58 -
 59
59 -
 60
60 -
 61
61 -
62
-
63
-
64
-
65
-
66
-
67
-
68
-
69
-
70
-
71
-
72
-
73
-
74
-
75
-
76
-
77
-
78
-
79
-
80
-
81
-
82
-
83
-
84
-
85
-
86
-
87
-
88
-
89
-
90
-
91
-
92
-
93
-
94
-
95
-
96
-
97
-
98
-
99
-
100
-
101
-
102
-
103
-
104
-
105
-
106
-
107
-
108
-
109
-
110
-
111
-
112
-
113
-
114
-
115
-
116
 |
 |

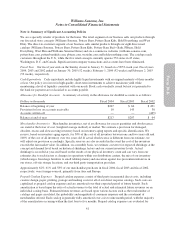
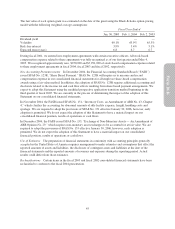
Foreign Currency Translation The functional currency of our Canadian subsidiary is the Canadian dollar.
Assets and liabilities are translated into U.S. dollars using the current exchange rates in effect at the balance sheet
date, while revenues and expenses are translated at the average exchange rates during the period. The resulting
translation adjustments are recorded as other comprehensive income within shareholders’ equity. Gains and
losses resulting from foreign currency transactions have not been significant and are included in selling, general
and administrative expenses.
Financial Instruments As of January 30, 2005, we have 11 retail stores in Canada, which expose us to market
risk associated with foreign currency exchange rate fluctuations. As necessary, we have utilized 30-day foreign
currency contracts to minimize any currency remeasurement risk associated with intercompany assets and
liabilities of our Canadian subsidiary. These contracts are accounted for by adjusting the carrying amount of the
contract to market and recognizing any gain or loss in selling, general and administrative expenses in each
reporting period. We did not enter into any new foreign currency contracts during fiscal 2004. Any gain or loss
associated with these contracts in prior years was not material to us.
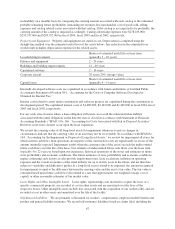
Income Taxes Income taxes are accounted for using the asset and liability method. Under this method, deferred
income taxes arise from temporary differences between the tax basis of assets and liabilities and their reported
amounts in the consolidated financial statements.
Earnings Per Share Basic earnings per share is computed as net earnings divided by the weighted average
number of common shares outstanding for the period. Diluted earnings per share is computed based on the
weighted average number of common shares outstanding for the period, plus common stock equivalents
consisting of shares subject to stock options.
Stock-Based Compensation We account for stock options granted to employees using the intrinsic value
method in accordance with Accounting Principles Board Opinion No. 25, “Accounting for Stock Issued to
Employees.” Accordingly, no compensation expense has been recognized in the consolidated financial
statements for stock options. SFAS No. 123, “Accounting for Stock-Based Compensation,” as amended by SFAS
No. 148, “Accounting for Stock-Based Compensation — Transition and Disclosure,” however, requires the
disclosure of pro forma net earnings and earnings per share as if we had adopted the fair value method. Under
SFAS No. 123, the fair value of stock-based awards to employees is calculated through the use of option pricing
models. These models require subjective assumptions, including future stock price volatility and expected time to
exercise, which affect the calculated values. Our calculations are based on a single option valuation approach and
forfeitures are recognized as they occur.
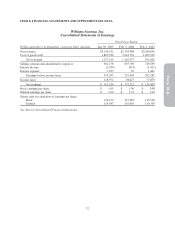
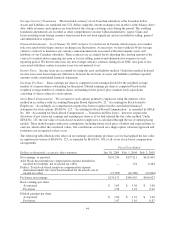
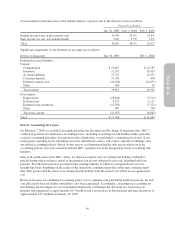
The following table illustrates the effect on net earnings and earnings per share as if we had applied the fair value
recognition provisions of SFAS No. 123, as amended by SFAS No. 148, to all of our stock-based compensation
arrangements.
Fiscal Year Ended
Dollars in thousands, except per share amounts Jan. 30, 2005 Feb. 1, 2004 Feb. 2, 2003
Net earnings, as reported $191,234 $157,211 $124,403
Add: Stock-based employee compensation expense included in
reported net earnings, net of related tax effect — 154 4,484
Deduct: Total stock-based employee compensation expense
determined under fair value based method for all awards, net of
related tax effect (17,059) (16,780) (22,864)
Pro forma net earnings $174,175 $140,585 $106,023
Basic earnings per share
As reported $ 1.65 $ 1.36 $ 1.08
Pro forma 1.50 1.22 0.92
Diluted earnings per share
As reported $ 1.60 $ 1.32 $ 1.04
Pro forma 1.47 1.16 0.87
44