Pottery Barn 2004 Annual Report Download - page 17
Download and view the complete annual report
Please find page 17 of the 2004 Pottery Barn annual report below. You can navigate through the pages in the report by either clicking on the pages listed below, or by using the keyword search tool below to find specific information within the annual report.-
 1
1 -
2
-
3
-
4
-
5
-
6
-
 7
7 -
 8
8 -
 9
9 -
 10
10 -
 11
11 -
 12
12 -
 13
13 -
 14
14 -
 15
15 -
 16
16 -
 17
17 -
 18
18 -
 19
19 -
 20
20 -
 21
21 -
 22
22 -
 23
23 -
 24
24 -
 25
25 -
 26
26 -
 27
27 -
28
-
29
-
30
-
31
-
32
-
33
-
34
-
35
-
36
-
37
-
38
-
39
-
40
-
41
-
42
-
43
-
44
-
45
-
46
-
47
-
48
-
49
-
50
-
51
-
52
-
53
-
54
-
55
-
56
-
57
-
58
-
59
-
60
-
61
-
62
-
63
-
64
-
65
-
66
-
67
-
68
-
69
-
70
-
71
-
72
-
73
-
74
-
75
-
76
-
77
-
78
-
79
-
80
-
81
-
82
-
83
-
84
-
85
-
86
-
87
-
88
-
89
-
90
-
91
-
92
-
93
-
94
-
95
-
96
-
97
-
98
-
99
-
100
-
101
-
102
-
103
-
104
-
105
-
106
-
107
-
108
-
109
-
110
-
111
-
112
-
113
-
114
-
115
-
116
 |
 |

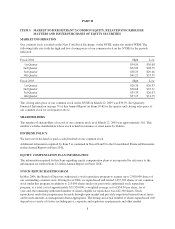
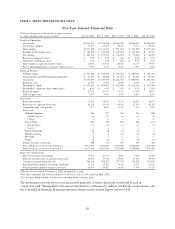
ITEM 6. SELECTED FINANCIAL DATA
Five-Year Selected Financial Data
Dollars and amounts in thousands, except percentages,
per share amounts and retail stores data Jan. 30, 2005 Feb. 1, 2004 Feb. 2, 2003 Feb. 3, 20021Jan. 28, 2001
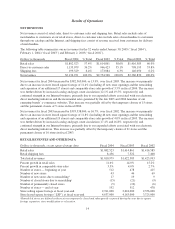
Results of Operations
Net revenues $3,136,931 $2,754,368 $2,360,830 $2,086,662 $1,829,483
Net revenues growth 13.9% 16.7% 13.1% 14.1% 25.3%
Gross margin $1,271,145 $1,110,577 $ 951,601 $ 793,989 $ 693,628
Earnings before income taxes $ 310,205 $ 255,638 $ 202,282 $ 122,106 $ 92,329
Net earnings $ 191,234 $ 157,211 $ 124,403 $ 75,096 $ 56,782
Basic net earnings per share2$ 1.65 $ 1.36 $ 1.08 $ 0.67 $ 0.51
Diluted net earnings per share2$ 1.60 $ 1.32 $ 1.04 $ 0.65 $ 0.49
Gross margin as a percent of net revenues 40.5% 40.3% 40.3% 38.1% 37.9%
Pre-tax operating margin as a percent of net revenues39.9% 9.3% 8.6% 5.9% 5.0%
Financial Position
Working capital $ 351,608 $ 245,005 $ 200,556 $ 120,060 $ 81,623
Long-term debt and other long-term obligations $ 32,476 $ 38,358 $ 23,217 $ 29,307 $ 28,267
Total assets $1,745,545 $1,470,735 $1,264,455 $ 994,903 $ 891,928
Return on assets 11.9% 11.5% 11.0% 8.3% 7.5%
Shareholders’ equity $ 957,662 $ 804,591 $ 643,978 $ 532,531 $ 427,458
Shareholders’ equity per share (book value)2$ 8.30 $ 6.95 $ 5.63 $ 4.65 $ 3.83
Return on equity 21.7% 21.7% 21.1% 15.6% 14.0%
Debt-to-equity ratio 4.4% 4.6% 4.0% 6.0% 8.3%
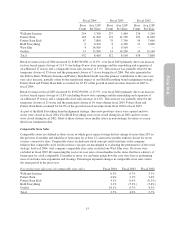
Retail Sales
Retail sales growth 11.6% 14.0% 15.2% 18.3% 19.6%
Retail sales as a percent of net sales 61.4% 62.6% 64.0% 62.6% 60.3%
Comparable store sales growth 3.5% 4.0% 2.7% 1.7% 5.5%
Store count
Williams-Sonoma: 254 237 236 214 200
Grande Cuisine 238 215 204 176 155
Classic 16 22 32 38 45
Pottery Barn: 183 174 159 145 136
Design Studio 181 168 153 137 124
Classic 266 812
Pottery Barn Kids 87 78 56 27 8
Hold Everything 9 8 13 15 26
West Elm 4 1 — — —
Outlets 15 14 14 14 12
Number of stores at year-end 552 512 478 415 382
Store selling area at fiscal year-end (sq. ft.) 2,911,000 2,624,000 2,356,000 2,012,000 1,764,000
Store leased area at fiscal year-end (sq. ft.) 4,637,000 4,163,000 3,725,000 3,179,000 2,753,000
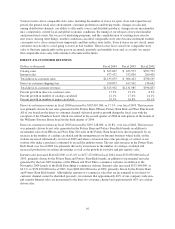
Direct-to-Customer Sales
Direct-to-customer sales growth 17.5% 21.1% 8.5% 7.4% 33.1%
Direct-to-customer sales as a percent of net sales 38.6% 37.4% 36.0% 37.4% 39.7%
Catalogs circulated during the year 368,210 328,355 279,724 245,224 233,199
Percent growth in number of catalogs circulated 12.1% 17.4% 14.1% 5.2% 21.0%
Percent growth in number of pages circulated 19.5% 16.8% 16.1% 1.4% 37.7%
1The fiscal year ended February 3, 2002 included 53 weeks.
2Per share amounts have been restated to reflect the 2-for-1 stock split in May 2002.
3Pre-tax operating margin is defined as earnings before income taxes.
The information set forth above is not necessarily indicative of future operations and should be read in
conjunction with “Management’s Discussion and Analysis of Financial Condition and Results of Operations” and
the Consolidated Financial Statements and notes thereto in this Annual Report on Form 10-K.
10