Pottery Barn 2004 Annual Report Download - page 26
Download and view the complete annual report
Please find page 26 of the 2004 Pottery Barn annual report below. You can navigate through the pages in the report by either clicking on the pages listed below, or by using the keyword search tool below to find specific information within the annual report.-
 1
1 -
2
-
3
-
4
-
5
-
6
-
7
-
8
-
9
-
10
-
11
-
12
-
13
-
14
-
15
-
 16
16 -
 17
17 -
 18
18 -
 19
19 -
 20
20 -
 21
21 -
 22
22 -
 23
23 -
 24
24 -
 25
25 -
 26
26 -
 27
27 -
 28
28 -
 29
29 -
 30
30 -
 31
31 -
 32
32 -
 33
33 -
 34
34 -
 35
35 -
 36
36 -
37
-
38
-
39
-
40
-
41
-
42
-
43
-
44
-
45
-
46
-
47
-
48
-
49
-
50
-
51
-
52
-
53
-
54
-
55
-
56
-
57
-
58
-
59
-
60
-
61
-
62
-
63
-
64
-
65
-
66
-
67
-
68
-
69
-
70
-
71
-
72
-
73
-
74
-
75
-
76
-
77
-
78
-
79
-
80
-
81
-
82
-
83
-
84
-
85
-
86
-
87
-
88
-
89
-
90
-
91
-
92
-
93
-
94
-
95
-
96
-
97
-
98
-
99
-
100
-
101
-
102
-
103
-
104
-
105
-
106
-
107
-
108
-
109
-
110
-
111
-
112
-
113
-
114
-
115
-
116
 |
 |

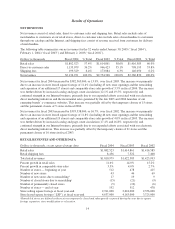
In the retail channel, selling, general and administrative expenses as a percentage of retail net revenues increased
approximately 30 basis points in fiscal 2004 versus fiscal 2003, primarily driven by increases in employment and
advertising costs. The increase in the employment rate was due in part to the up front investment required in the
emerging brands prior to the opening of our new store locations.
In the direct-to-customer channel, selling, general and administrative expenses as a percentage of direct-to-
customer net revenues decreased by approximately 90 basis points in fiscal 2004 compared to fiscal 2003. This
improvement was primarily driven by a rate reduction in catalog advertising and employment costs. The rate
reduction in catalog advertising costs was driven by lower catalog circulation in the emerging brands coupled
with continued sales generation by our e-commerce sites. This decrease was partially offset by growth in the rate
of other general expenses primarily due to third party outsourcing of distribution services.
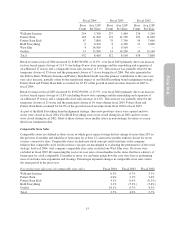
Fiscal 2003 vs. Fiscal 2002
Selling, general and administrative expenses increased by $106,491,000 to $855,790,000 in fiscal 2003 from
$749,299,000 in fiscal 2002 and, as a percent of net revenues, decreased by 60 basis points to 31.1% in fiscal
2003 from 31.7% in fiscal 2002. The improvement in selling, general and administrative expenses as a
percentage of net revenues was attributable to lower year-over-year employment expense, partially offset by an
increase in catalog advertising expense. The employment cost decrease was primarily driven by a year-over-year
reduction in incentive compensation and employee separation costs associated with the departure of our former
Chief Executive Officer during fiscal 2002. The increase in catalog advertising expense as a percentage of net
revenues was primarily driven by a greater percentage of total company net revenues in fiscal 2003 being
generated by the direct-to-customer channel, which incurs substantially higher catalog advertising costs than the
retail channel. In addition, significantly higher advertising costs as a percentage of net revenues were incurred in
the new and emerging catalog concepts, PBteen and West Elm.
In the retail channel, selling, general and administrative expenses as a percentage of retail net revenues was
unchanged in fiscal 2003 from fiscal 2002. Reductions in advertising expense as a percentage of net revenues
offset increases in employment and other general expenses as a percentage of net revenues.
In the direct-to-customer channel, selling, general and administrative expenses as a percentage of direct-to-
customer net revenues increased 90 basis points in fiscal 2003 versus fiscal 2002, primarily due to significantly
higher advertising costs as a percentage of net revenues being incurred in the emerging brands resulting from
higher levels of prospecting during the year.
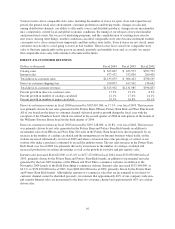
INTEREST INCOME AND EXPENSE
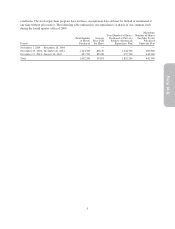
Interest income was $1,939,000 in fiscal 2004, $873,000 in fiscal 2003, and $1,421,000 in fiscal 2002, comprised
primarily of income from short-term investments classified as cash and cash equivalents.
Interest expense was $1,703,000 (net of capitalized interest of $1,689,000), $22,000 (net of capitalized interest of
$2,142,000), and $1,441,000 (net of capitalized interest of $1,269,000) for fiscal 2004, fiscal 2003 and fiscal
2002, respectively. Interest expense increased by $1,681,000 to $1,703,000 in fiscal 2004, primarily due to
additional interest expense of $1,525,000 associated with the consolidation of our Memphis-based distribution
facilities. Prior to the adoption of Financial Accounting Standards Board (“FASB”) Interpretation No. (“FIN”)
46R, “Consolidation of Variable Interest Entities,” this expense would have been classified as occupancy
expense. Interest expense decreased by $1,419,000 to $22,000 in fiscal 2003, primarily due to an increase in the
amount of interest capitalized resulting from additional long-term capital projects under development in fiscal
2003 and lower interest expense on our senior notes and capital leases.
INCOME TAXES
Our effective tax rate was 38.4% for fiscal 2004 and 38.5% for fiscal 2003 and fiscal 2002. We currently expect
our fiscal 2005 effective tax rate to be in the range of 38.1% to 38.5%.
19
Form 10-K