Pottery Barn 2004 Annual Report Download - page 24
Download and view the complete annual report
Please find page 24 of the 2004 Pottery Barn annual report below. You can navigate through the pages in the report by either clicking on the pages listed below, or by using the keyword search tool below to find specific information within the annual report.-
 1
1 -
2
-
3
-
4
-
5
-
6
-
7
-
8
-
9
-
10
-
11
-
12
-
13
-
 14
14 -
 15
15 -
 16
16 -
 17
17 -
 18
18 -
 19
19 -
 20
20 -
 21
21 -
 22
22 -
 23
23 -
 24
24 -
 25
25 -
 26
26 -
 27
27 -
 28
28 -
 29
29 -
 30
30 -
 31
31 -
 32
32 -
 33
33 -
 34
34 -
35
-
36
-
37
-
38
-
39
-
40
-
41
-
42
-
43
-
44
-
45
-
46
-
47
-
48
-
49
-
50
-
51
-
52
-
53
-
54
-
55
-
56
-
57
-
58
-
59
-
60
-
61
-
62
-
63
-
64
-
65
-
66
-
67
-
68
-
69
-
70
-
71
-
72
-
73
-
74
-
75
-
76
-
77
-
78
-
79
-
80
-
81
-
82
-
83
-
84
-
85
-
86
-
87
-
88
-
89
-
90
-
91
-
92
-
93
-
94
-
95
-
96
-
97
-
98
-
99
-
100
-
101
-
102
-
103
-
104
-
105
-
106
-
107
-
108
-
109
-
110
-
111
-
112
-
113
-
114
-
115
-
116
 |
 |

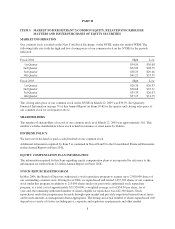
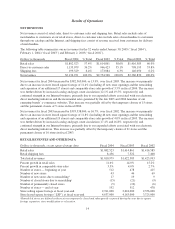
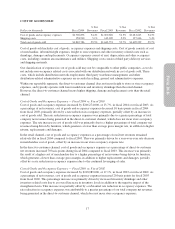
COST OF GOODS SOLD
Dollars in thousands Fiscal 2004
%Net
Revenues Fiscal 2003
%Net
Revenues Fiscal 2002
%Net
Revenues
Cost of goods and occupancy expenses $1,706,876 54.4% $1,500,602 54.5% $1,281,613 54.3%
Shipping costs 158,910 5.1% 143,189 5.2% 127,616 5.4%
Total cost of goods sold $1,865,786 59.5% $1,643,791 59.7% $1,409,229 59.7%
Cost of goods sold includes cost of goods, occupancy expenses and shipping costs. Cost of goods consists of cost
of merchandise, inbound freight expenses, freight to store expenses and other inventory related costs such as
shrinkage, damages and replacements. Occupancy expenses consist of rent, depreciation and other occupancy
costs, including common area maintenance and utilities. Shipping costs consist of third party delivery services
and shipping materials.
Our classification of expenses in cost of goods sold may not be comparable to other public companies, as we do
not include non-occupancy related costs associated with our distribution network in cost of goods sold. These
costs, which include distribution network employment, third party warehouse management, and other
distribution-related administrative expenses are recorded in selling, general and administrative expenses.
Within our reportable segments, the direct-to-customer channel does not incur freight to store or store occupancy
expenses, and typically operates with lower markdowns and inventory shrinkage than the retail channel.
However, the direct-to-customer channel incurs higher shipping, damage and replacement costs than the retail
channel.
Cost of Goods and Occupancy Expenses — Fiscal 2004 vs. Fiscal 2003
Cost of goods and occupancy expenses increased by $206,274,000, or 13.7%, in fiscal 2004 over fiscal 2003. As
a percentage of net revenues, cost of goods and occupancy expenses decreased 10 basis points in fiscal 2004
from fiscal 2003, primarily driven by a rate reduction in occupancy expenses, partially offset by an increase in
cost of goods sold. The rate reduction in occupancy expenses was primarily due to a greater percentage of total
company net revenues being generated in the direct-to-customer channel, which does not incur store occupancy
expenses. The rate increase in cost of goods sold was primarily due to a higher percentage of total company net
revenues being driven by furniture, which generates a lower than average gross margin rate, in addition to higher
returns, replacements and damages.
In the retail channel, cost of goods and occupancy expenses as a percentage of retail net revenues remained
relatively flat in fiscal 2004 compared to fiscal 2003. This was primarily driven by a year-over-year rate decrease
in merchandise cost of goods, offset by an increase in our store occupancy expense rate.
In the direct-to-customer channel, cost of goods and occupancy expenses as a percentage of direct-to-customer
net revenues increased 70 basis points during fiscal 2004 compared to fiscal 2003. This increase was primarily
the result of a higher cost of merchandise due to a higher percentage of net revenues being driven by furniture,
which generates a lower than average gross margin, in addition to higher replacements and damages, partially
offset by a rate reduction in occupancy expenses due to the continued leveraging of sales.
Cost of Goods and Occupancy Expenses — Fiscal 2003 vs. Fiscal 2002
Cost of goods and occupancy expenses increased by $218,989,000, or 17.1%, in fiscal 2003 over fiscal 2002. As
a percentage of net revenues, cost of goods and occupancy expenses increased 20 basis points for fiscal 2003
from fiscal 2002. This percentage increase was primarily driven by increased inventory shrinkage and other
inventory related costs due to an overall increase in inventory levels in addition to the negative impact of the
strengthened euro. This increase was partially offset by a substantial rate reduction in occupancy expenses. The
rate reduction in occupancy expenses was attributable to a greater percentage of our total company net revenues
being generated in the direct-to-customer channel, which does not incur store occupancy expenses.
17
Form 10-K