Pottery Barn 2004 Annual Report Download - page 21
Download and view the complete annual report
Please find page 21 of the 2004 Pottery Barn annual report below. You can navigate through the pages in the report by either clicking on the pages listed below, or by using the keyword search tool below to find specific information within the annual report.-
 1
1 -
2
-
3
-
4
-
5
-
6
-
7
-
8
-
9
-
10
-
 11
11 -
 12
12 -
 13
13 -
 14
14 -
 15
15 -
 16
16 -
 17
17 -
 18
18 -
 19
19 -
 20
20 -
 21
21 -
 22
22 -
 23
23 -
 24
24 -
 25
25 -
 26
26 -
 27
27 -
 28
28 -
 29
29 -
 30
30 -
 31
31 -
32
-
33
-
34
-
35
-
36
-
37
-
38
-
39
-
40
-
41
-
42
-
43
-
44
-
45
-
46
-
47
-
48
-
49
-
50
-
51
-
52
-
53
-
54
-
55
-
56
-
57
-
58
-
59
-
60
-
61
-
62
-
63
-
64
-
65
-
66
-
67
-
68
-
69
-
70
-
71
-
72
-
73
-
74
-
75
-
76
-
77
-
78
-
79
-
80
-
81
-
82
-
83
-
84
-
85
-
86
-
87
-
88
-
89
-
90
-
91
-
92
-
93
-
94
-
95
-
96
-
97
-
98
-
99
-
100
-
101
-
102
-
103
-
104
-
105
-
106
-
107
-
108
-
109
-
110
-
111
-
112
-
113
-
114
-
115
-
116
 |
 |

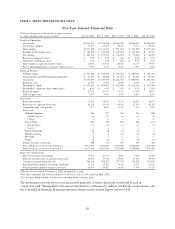
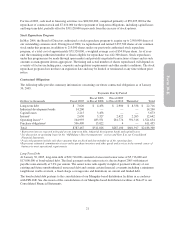
Results of Operations
NET REVENUES
Net revenues consist of retail sales, direct-to-customer sales and shipping fees. Retail sales include sales of
merchandise to customers at our retail stores, direct-to-customer sales include sales of merchandise to customers
through our catalogs and the Internet, and shipping fees consist of revenue received from customers for delivery
of merchandise.
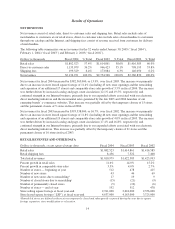
The following table summarizes our net revenues for the 52 weeks ended January 30, 2005 (“fiscal 2004”),
February 1, 2004 (“fiscal 2003”) and February 2, 2003 (“fiscal 2002”).
Dollars in thousands Fiscal 2004 % Total Fiscal 2003 % Total Fiscal 2002 % Total
Retail sales $1,802,523 57.4% $1,614,861 58.6% $1,416,585 60.0%
Direct-to-customer sales 1,135,079 36.2% 966,423 35.1% 798,195 33.8%
Shipping fees 199,329 6.4% 173,084 6.3% 146,050 6.2%
Net revenues $3,136,931 100.0% $2,754,368 100.0% $2,360,830 100.0%
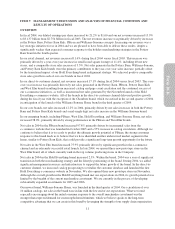
Net revenues for fiscal 2004 increased by $382,563,000, or 13.9%, over fiscal 2003. The increase was primarily
due to an increase in store leased square footage of 11.4% (including 43 new store openings and the remodeling
and expansion of an additional 17 stores) and comparable store sales growth of 3.5% in fiscal 2004. The increase
was further driven by increased catalog and page count circulation (12.1% and 19.5%, respectively) and
continued strength in our Internet business, primarily due to our expanded efforts associated with our electronic
direct marketing initiatives and the incremental sales generated by the late 2003 and 2004 launches of our
emerging brands’ e-commerce websites. This increase was partially offset by the temporary closure of 15 stores
and the permanent closure of 5 stores in fiscal 2004.
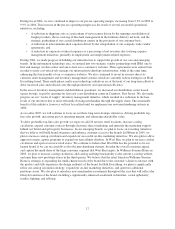
Net revenues for fiscal 2003 increased by $393,538,000, or 16.7%, over fiscal 2002. The increase was primarily
due to an increase in store leased square footage of 11.8% (including 46 new store openings and the remodeling
and expansion of an additional 19 stores) and comparable store sales growth of 4.0% in fiscal 2003. The increase
was further driven by increased catalog and page count circulation (17.4% and 16.8%, respectively) and
continued strength in our Internet business, primarily due to our expanded efforts associated with our electronic
direct marketing initiatives. This increase was partially offset by the temporary closure of 21 stores and the
permanent closure of 10 stores in fiscal 2003.
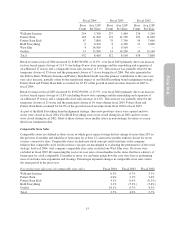
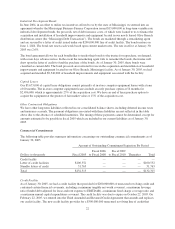
RETAIL REVENUES AND OTHER DATA
Dollars in thousands, except square footage data Fiscal 2004 Fiscal 2003 Fiscal 2002
Retail sales $1,802,523 $1,614,861 $1,416,585
Retail shipping fees 8,456 7,522 7,408
Total retail revenues $1,810,979 $1,622,383 $1,423,993
Percent growth in retail sales 11.6% 14.0% 15.2%
Percent growth in comparable store sales 3.5% 4.0% 2.7%
Number of stores — beginning of year 512 478 415
Number of new stores 43 46 69
Number of new stores due to remodeling117 19 9
Number of closed stores due to remodeling1(15) (21) (9)
Number of permanently closed stores (5) (10) (6)
Number of stores — end of year 552 512 478
Store selling square footage at fiscal year-end 2,911,000 2,624,000 2,356,000
Store leased square footage (“LSF”) at fiscal year-end 4,637,000 4,163,000 3,725,000
1Remodeled stores are defined as those stores temporarily closed and subsequently reopened during the year due to square
footage expansion, store modification or relocation.
14