Pottery Barn 2004 Annual Report Download - page 22
Download and view the complete annual report
Please find page 22 of the 2004 Pottery Barn annual report below. You can navigate through the pages in the report by either clicking on the pages listed below, or by using the keyword search tool below to find specific information within the annual report.-
 1
1 -
2
-
3
-
4
-
5
-
6
-
7
-
8
-
9
-
10
-
11
-
 12
12 -
 13
13 -
 14
14 -
 15
15 -
 16
16 -
 17
17 -
 18
18 -
 19
19 -
 20
20 -
 21
21 -
 22
22 -
 23
23 -
 24
24 -
 25
25 -
 26
26 -
 27
27 -
 28
28 -
 29
29 -
 30
30 -
 31
31 -
 32
32 -
33
-
34
-
35
-
36
-
37
-
38
-
39
-
40
-
41
-
42
-
43
-
44
-
45
-
46
-
47
-
48
-
49
-
50
-
51
-
52
-
53
-
54
-
55
-
56
-
57
-
58
-
59
-
60
-
61
-
62
-
63
-
64
-
65
-
66
-
67
-
68
-
69
-
70
-
71
-
72
-
73
-
74
-
75
-
76
-
77
-
78
-
79
-
80
-
81
-
82
-
83
-
84
-
85
-
86
-
87
-
88
-
89
-
90
-
91
-
92
-
93
-
94
-
95
-
96
-
97
-
98
-
99
-
100
-
101
-
102
-
103
-
104
-
105
-
106
-
107
-
108
-
109
-
110
-
111
-
112
-
113
-
114
-
115
-
116
 |
 |

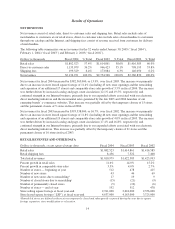
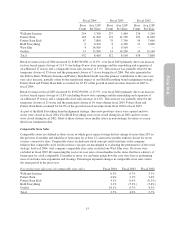
Fiscal 2004 Fiscal 2003 Fiscal 2002
Store
Count
Avg. LSF
Per Store
Store
Count
Avg. LSF
Per Store
Store
Count
Avg. LSF
Per Store
Williams-Sonoma 254 5,700 237 5,400 236 5,200
Pottery Barn 183 11,900 174 11,700 159 11,600
Pottery Barn Kids 87 7,800 78 7,700 56 7,600
Hold Everything 9 6,100 8 4,300 13 3,800
West Elm 4 14,500 1 9,500 — —
Outlets 15 15,500 14 14,200 14 13,100
Total 552 8,400 512 8,100 478 7,800
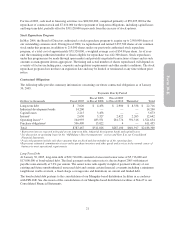
Retail revenues in fiscal 2004 increased by $188,596,000, or 11.6%, over fiscal 2003 primarily due to an increase
in store leased square footage of 11.4 % (including 43 new store openings and the remodeling and expansion of
an additional 17 stores) and a comparable store sales increase of 3.5%. This increase was partially offset by the
temporary closure of 15 stores and the permanent closure of 5 stores during fiscal 2004. Net sales generated in
the Pottery Barn, Williams-Sonoma and Pottery Barn Kids brands were the primary contributors to the year-over-
year sales increase, partially offset by the transitional impact of our Hold Everything brand realignment strategy.
Pottery Barn and Pottery Barn Kids accounted for 65.8% of the growth in retail revenues from fiscal 2003 to
fiscal 2004.
Retail revenues in fiscal 2003 increased by $198,390,000, or 13.9%, over fiscal 2002 primarily due to an increase
in store leased square footage of 11.8% (including 46 new store openings and the remodeling and expansion of
an additional 19 stores) and a comparable store sales increase of 4.0%. This increase was partially offset by the
temporary closure of 21 stores and the permanent closure of 10 stores during fiscal 2003. Pottery Barn and
Pottery Barn Kids accounted for 64.0% of the growth in retail revenues from fiscal 2002 to fiscal 2003.
As part of the Hold Everything brand realignment strategy, three new prototype stores were opened and two
stores were closed in fiscal 2004. Five Hold Everything stores were closed during fiscal 2003 and two stores
were closed during fiscal 2002. Most of these closures were smaller stores in non-strategic locations at or near
their lease termination date.
Comparable Store Sales
Comparable stores are defined as those stores in which gross square footage did not change by more than 20% in
the previous 12 months and which have been open for at least 12 consecutive months without closure for seven
or more consecutive days. Comparable stores exclude new retail concepts until such time as the company
believes that comparable store results in those concepts are meaningful to evaluating the performance of the retail
strategy. In fiscal 2004, total company comparable store sales excluded one West Elm store. No stores were
excluded in fiscal 2003. By measuring the year-over-year sales of merchandise in the stores that have a history of
being open for a full comparable 12 months or more, we can better gauge how the core store base is performing
since it excludes store expansions and closings. Percentages represent changes in comparable store sales versus
the same period in the prior year.
Percent increase (decrease) in comparable store sales Fiscal 2004 Fiscal 2003 Fiscal 2002
Williams-Sonoma 0.5% 6.7% 3.3%
Pottery Barn 4.6% 2.3% 2.6%
Pottery Barn Kids 4.1% 0.4% (0.3%)
Hold Everything 2.1% (5.2%) (5.4%)
Outlets 18.1% 6.7% 4.3%
Total 3.5% 4.0% 2.7%
15
Form 10-K