Pottery Barn 2004 Annual Report Download - page 25
Download and view the complete annual report
Please find page 25 of the 2004 Pottery Barn annual report below. You can navigate through the pages in the report by either clicking on the pages listed below, or by using the keyword search tool below to find specific information within the annual report.-
 1
1 -
2
-
3
-
4
-
5
-
6
-
7
-
8
-
9
-
10
-
11
-
12
-
13
-
14
-
 15
15 -
 16
16 -
 17
17 -
 18
18 -
 19
19 -
 20
20 -
 21
21 -
 22
22 -
 23
23 -
 24
24 -
 25
25 -
 26
26 -
 27
27 -
 28
28 -
 29
29 -
 30
30 -
 31
31 -
 32
32 -
 33
33 -
 34
34 -
 35
35 -
36
-
37
-
38
-
39
-
40
-
41
-
42
-
43
-
44
-
45
-
46
-
47
-
48
-
49
-
50
-
51
-
52
-
53
-
54
-
55
-
56
-
57
-
58
-
59
-
60
-
61
-
62
-
63
-
64
-
65
-
66
-
67
-
68
-
69
-
70
-
71
-
72
-
73
-
74
-
75
-
76
-
77
-
78
-
79
-
80
-
81
-
82
-
83
-
84
-
85
-
86
-
87
-
88
-
89
-
90
-
91
-
92
-
93
-
94
-
95
-
96
-
97
-
98
-
99
-
100
-
101
-
102
-
103
-
104
-
105
-
106
-
107
-
108
-
109
-
110
-
111
-
112
-
113
-
114
-
115
-
116
 |
 |
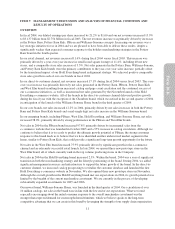
In the retail channel, cost of goods and occupancy expenses as a percentage of retail net revenues increased
approximately 100 basis points during fiscal 2003 compared to fiscal 2002. This change in rate was primarily
driven by an increase in our cost of merchandise, including the negative impact of the strengthened Euro as well
as higher markdowns, and a year-over-year increase in inventory shrinkage associated with the reinstatement of
inventory to historical levels.
In the direct-to-customer channel, cost of goods and occupancy expenses as a percentage of direct-to-customer
net revenues decreased 40 basis points during fiscal 2003 compared to fiscal 2002. This was primarily the result
of a reduction in occupancy expenses, partially offset by an increase in our cost of merchandise, increased
inventory shrinkage and other inventory related costs due to an overall increase in inventory levels. The
reduction in the occupancy rate was attributable to a reduction in depreciation expense resulting from the
development costs associated with certain e-commerce websites becoming fully depreciated.
Shipping Costs — Fiscal 2004 vs. Fiscal 2003
Shipping costs increased by $15,721,000, or 11.0%, in fiscal 2004 over fiscal 2003 due to a higher number of
direct-to-customer shipments associated with the increase in direct-to-customer sales as well as a shift in the mix
of product being shipped, with furniture accounting for a greater portion of the overall mix. We also incurred
additional cost earlier in the year as we overcame initial challenges of balancing inventory allocations between
the coastal distribution centers and a need to ship merchandise out of market to our customers in order to fill
backorders. This increase was substantially offset by a lower cost per shipment due to the full year benefit of
expense reductions in 2004 associated with the mid-2003 consolidation of freight providers, the in-sourcing of
line-haul management in the furniture delivery network, and reductions in furniture delivery costs driven by
efficiencies gained from the new east coast distribution center. As a result of these efficiencies, shipping costs, as
a percentage of shipping fees, have continued to decline to 79.7% in fiscal 2004 from 82.7% in fiscal 2003 and
87.4% in fiscal 2002.
Shipping Costs — Fiscal 2003 vs. Fiscal 2002
Shipping costs increased $15,573,000, or 12.2%, in fiscal 2003 over fiscal 2002 due to a higher number of direct-
to-customer shipments associated with the increase in direct-to-customer sales as well as a shift in the mix of
product being shipped, with furniture accounting for a greater portion of the overall mix. This increase was
substantially offset by a lower cost per shipment due to the consolidation of freight providers and the successful
renegotiation of freight-to-customer contracts.
SELLING, GENERAL AND ADMINISTRATIVE EXPENSES
Selling, general and administrative expenses consist of non-occupancy related costs associated with our retail
stores, distribution warehouses, customer care centers, supply chain operations (buying, receiving and
inspection), and corporate administrative functions. These costs include employment, advertising, third party
credit card processing, and other general expenses.
Due to their distinct distribution and marketing strategies, we experience differing employment and advertising
costs as a percentage of net revenues within the retail and direct-to-customer segments. Store employment costs
represent a greater percentage of retail net revenues than employment costs as a percentage of net revenues
within the direct-to-customer segment. However, catalog advertising expenses are greater within the direct-to-
customer channel than the retail channel.
Fiscal 2004 vs. Fiscal 2003
Selling, general and administrative expenses increased by $105,386,000, or 12.3%, to $961,176,000 in fiscal
2004 from $855,790,000 in fiscal 2003. Selling, general and administrative expenses expressed as a percentage
of net revenues decreased to 30.6% in fiscal 2004 from 31.1% in fiscal 2003. This 50 basis point improvement as
a percentage of net revenues was primarily due to a rate reduction in year-over-year employment expenses.
Contributing to the employment rate decrease were year-over-year reductions in workers’ compensation and
other employment-related costs.
18