Pottery Barn 2004 Annual Report Download - page 47
Download and view the complete annual report
Please find page 47 of the 2004 Pottery Barn annual report below. You can navigate through the pages in the report by either clicking on the pages listed below, or by using the keyword search tool below to find specific information within the annual report.-
 1
1 -
2
-
3
-
4
-
5
-
6
-
7
-
8
-
9
-
10
-
11
-
12
-
13
-
14
-
15
-
16
-
17
-
18
-
19
-
20
-
21
-
22
-
23
-
24
-
25
-
26
-
27
-
28
-
29
-
30
-
31
-
32
-
33
-
34
-
35
-
36
-
 37
37 -
 38
38 -
 39
39 -
 40
40 -
 41
41 -
 42
42 -
 43
43 -
 44
44 -
 45
45 -
 46
46 -
 47
47 -
 48
48 -
 49
49 -
 50
50 -
 51
51 -
 52
52 -
 53
53 -
 54
54 -
 55
55 -
 56
56 -
 57
57 -
58
-
59
-
60
-
61
-
62
-
63
-
64
-
65
-
66
-
67
-
68
-
69
-
70
-
71
-
72
-
73
-
74
-
75
-
76
-
77
-
78
-
79
-
80
-
81
-
82
-
83
-
84
-
85
-
86
-
87
-
88
-
89
-
90
-
91
-
92
-
93
-
94
-
95
-
96
-
97
-
98
-
99
-
100
-
101
-
102
-
103
-
104
-
105
-
106
-
107
-
108
-
109
-
110
-
111
-
112
-
113
-
114
-
115
-
116
 |
 |

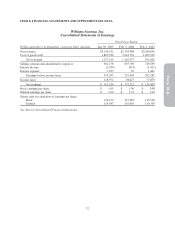
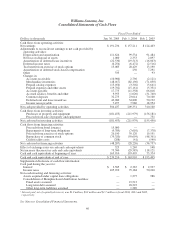
Williams-Sonoma, Inc.
Consolidated Statements of Cash Flows
Fiscal Year Ended
Dollars in thousands Jan. 30, 2005 Feb. 1, 2004 Feb. 2, 2003
Cash flows from operating activities:
Net earnings $ 191,234 $ 157,211 $ 124,403
Adjustments to reconcile net earnings to net cash provided by
operating activities:
Depreciation and amortization 111,624 99,534 91,484
Net loss on disposal of assets 1,080 2,353 2,897
Amortization of deferred lease incentives (22,530) (19,513) (16,063)
Deferred income taxes (6,254) (6,472) (2,516)
Tax benefit from exercise of stock options 13,085 20,429 13,190
Amortization of deferred stock-based compensation — 250 7,291
Other 335 — 93
Changes in:
Accounts receivable (10,900) 2,796 (2,121)
Merchandise inventories (48,017) (82,196) (71,850)
Prepaid catalog expenses (15,056) (3,302) (5,641)
Prepaid expenses and other assets (19,702) (15,161) (5,331)
Accounts payable 17,773 (11,358) 66,818
Accrued salaries, benefits and other 9,955 (1,020) (31,740)
Customer deposits 32,273 23,014 70,100
Deferred rent and lease incentives 42,080 34,800 50,192
Income taxes payable 7,457 7,986 18,954
Net cash provided by operating activities 304,437 209,351 310,160
Cash flows from investing activities:
Purchases of property and equipment (181,453) (211,979) (156,181)
Proceeds from sale of property and equipment — — 731
Net cash used in investing activities (181,453) (211,979) (155,450)
Cash flows from financing activities:
Proceeds from bond issuance 15,000 — —
Repayments of long-term obligations (9,789) (7,610) (7,378)
Proceeds from exercise of stock options 26,190 39,120 19,551
Repurchase of common stock (79,320) (59,695) (48,361)
Credit facility costs (288) (41) (549)
Net cash used in financing activities (48,207) (28,226) (36,737)
Effect of exchange rates on cash and cash equivalents 523 1,269 148
Net increase (decrease) in cash and cash equivalents 75,300 (29,585) 118,121
Cash and cash equivalents at beginning of year 163,910 193,495 75,374
Cash and cash equivalents at end of year $ 239,210 $ 163,910 $ 193,495
Supplemental disclosure of cash flow information:
Cash paid during the year for:
Interest1$ 3,585 $ 2,367 $ 2,937
Income taxes 105,910 79,184 50,240
Non cash investing and financing activities:
Assets acquired under capital lease obligations — 1,275 986
Consolidation of Memphis-based distribution facilities:
Fixed assets assumed
Long-term debt assumed
Other long-term liabilities assumed
—
—
—
19,512
18,223
1,289
—
—
—
1Interest paid, net of capitalized interest, was $1.9 million, $0.2 million and $1.7 million in fiscal 2004, 2003 and 2002,
respectively.
See Notes to Consolidated Financial Statements.
40