Pottery Barn 2004 Annual Report Download - page 48
Download and view the complete annual report
Please find page 48 of the 2004 Pottery Barn annual report below. You can navigate through the pages in the report by either clicking on the pages listed below, or by using the keyword search tool below to find specific information within the annual report.-
 1
1 -
2
-
3
-
4
-
5
-
6
-
7
-
8
-
9
-
10
-
11
-
12
-
13
-
14
-
15
-
16
-
17
-
18
-
19
-
20
-
21
-
22
-
23
-
24
-
25
-
26
-
27
-
28
-
29
-
30
-
31
-
32
-
33
-
34
-
35
-
36
-
37
-
 38
38 -
 39
39 -
 40
40 -
 41
41 -
 42
42 -
 43
43 -
 44
44 -
 45
45 -
 46
46 -
 47
47 -
 48
48 -
 49
49 -
 50
50 -
 51
51 -
 52
52 -
 53
53 -
 54
54 -
 55
55 -
 56
56 -
 57
57 -
 58
58 -
59
-
60
-
61
-
62
-
63
-
64
-
65
-
66
-
67
-
68
-
69
-
70
-
71
-
72
-
73
-
74
-
75
-
76
-
77
-
78
-
79
-
80
-
81
-
82
-
83
-
84
-
85
-
86
-
87
-
88
-
89
-
90
-
91
-
92
-
93
-
94
-
95
-
96
-
97
-
98
-
99
-
100
-
101
-
102
-
103
-
104
-
105
-
106
-
107
-
108
-
109
-
110
-
111
-
112
-
113
-
114
-
115
-
116
 |
 |

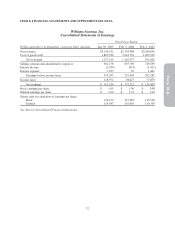
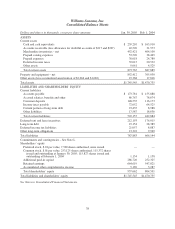
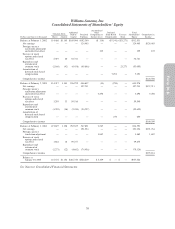
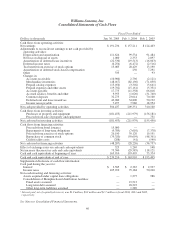
Williams-Sonoma, Inc.
Notes to Consolidated Financial Statements
Note A: Summary of Significant Accounting Policies
We are a specialty retailer of products for the home. The retail segment of our business sells our products through
our five retail store concepts (Williams-Sonoma, Pottery Barn, Pottery Barn Kids, Hold Everything, and West
Elm). The direct-to-customer segment of our business sells similar products through our eight direct-mail
catalogs (Williams-Sonoma, Pottery Barn, Pottery Barn Kids, Pottery Barn Bed + Bath, PBteen, Hold
Everything, West Elm and Williams-Sonoma Home) and six e-commerce websites (williams-sonoma.com,
potterybarn.com, potterybarnkids.com, pbteen.com, westelm.com and holdeverything.com). The catalogs reach
customers throughout the U.S., while the five retail concepts currently operate 552 stores in 43 states,
Washington, D.C. and Canada. Significant intercompany transactions and accounts have been eliminated.
Fiscal Year Our fiscal year ends on the Sunday closest to January 31, based on a 52/53-week year. Fiscal years
2004, 2003 and 2002 ended on January 30, 2005 (52 weeks), February 1, 2004 (52 weeks) and February 2, 2003
(52 weeks), respectively.
Cash Equivalents Cash equivalents include highly liquid investments with an original maturity of three months
or less. Our policy is to invest in high-quality, short-term instruments to achieve maximum yield while
maintaining a level of liquidity consistent with our needs. Book cash overdrafts issued but not yet presented to
the bank for payment are reclassified to accounts payable.
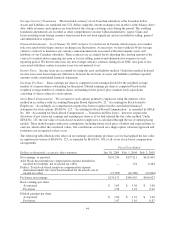
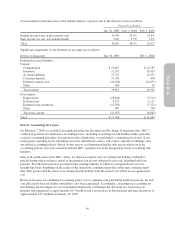
Allowance for Doubtful Accounts A summary of activity in the allowance for doubtful accounts is as follows:
Dollars in thousands Fiscal 2004 Fiscal 2003 Fiscal 2002
Balance at beginning of year $207 $ 64 $ 491
Provision for loss on accounts receivable 10 143 38
Accounts written off — — (465)
Balance at end of year $217 $207 $ 64
Merchandise Inventories Merchandise inventories, net of an allowance for excess quantities and obsolescence,
are stated at the lower of cost (weighted average method) or market. We estimate a provision for damaged,
obsolete, excess and slow-moving inventory based on inventory aging reports and specific identification. We
reserve, based on inventory aging reports, for 50% of the cost of all inventory between one and two years old and
100% of the cost of all inventory over two years old. If actual obsolescence is different from our estimate, we
will adjust our provision accordingly. Specific reserves are also recorded in the event the cost of the inventory
exceeds the fair market value. In addition, on a monthly basis, we estimate a reserve for expected shrinkage at the
concept and channel level based on historical shrinkage factors and our current inventory levels. Actual
shrinkage is recorded at year-end based on the results of our physical inventory count and can vary from our
estimates due to such factors as changes in operations within our distribution centers, the mix of our inventory
(which ranges from large furniture to small tabletop items) and execution against loss prevention initiatives in
our stores, off-site storage locations, and our third party transportation providers.
Approximately 62%, 61% and 58% of our merchandise purchases in fiscal 2004, fiscal 2003 and fiscal 2002,
respectively, were foreign-sourced, primarily from Asia and Europe.
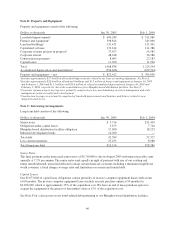
Prepaid Catalog Expenses Prepaid catalog expenses consist of third party incremental direct costs, including
creative design, paper, printing, postage and mailing costs for all of our direct response catalogs. Such costs are
capitalized as prepaid catalog expenses and are amortized over their expected period of future benefit. Such
amortization is based upon the ratio of actual revenues to the total of actual and estimated future revenues on an
individual catalog basis. Estimated future revenues are based upon various factors such as the total number of
catalogs and pages circulated, the probability and magnitude of consumer response and the assortment of
merchandise offered. Each catalog is generally fully amortized over a six to nine month period, with the majority
of the amortization occurring within the first four to five months. Prepaid catalog expenses are evaluated for
41
Form 10-K