Pizza Hut 2002 Annual Report Download - page 70
Download and view the complete annual report
Please find page 70 of the 2002 Pizza Hut annual report below. You can navigate through the pages in the report by either clicking on the pages listed below, or by using the keyword search tool below to find specific information within the annual report.-
 1
1 -
2
-
3
-
4
-
5
-
6
-
7
-
8
-
9
-
10
-
11
-
12
-
13
-
14
-
15
-
16
-
17
-
18
-
19
-
20
-
21
-
22
-
23
-
24
-
25
-
26
-
27
-
28
-
29
-
30
-
31
-
32
-
33
-
34
-
35
-
36
-
37
-
38
-
39
-
40
-
41
-
42
-
43
-
44
-
45
-
46
-
47
-
48
-
49
-
50
-
51
-
52
-
53
-
54
-
55
-
56
-
57
-
58
-
59
-
 60
60 -
 61
61 -
 62
62 -
 63
63 -
 64
64 -
 65
65 -
 66
66 -
 67
67 -
 68
68 -
 69
69 -
 70
70 -
 71
71 -
 72
72 -
 73
73 -
 74
74 -
 75
75 -
 76
76 -
 77
77 -
 78
78 -
 79
79 -
 80
80
 |
 |

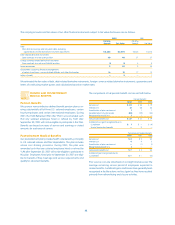
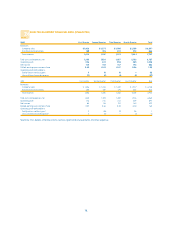
The details of 2002 and 2001 deferred tax liabilities (assets) are set
forth below:
2002 2001
Intangible assets and property,
plant and equipment $ 229 $ 176
Other 76 29
Gross deferred tax liabilities $ 305 $ 205
Net operating loss and tax credit carryforwards $(176) $ (171)
Employee benefits (100) (73)
Self-insured casualty claims (58) (62)
Capital leases and future rent obligations
related to sale-leaseback agreements (114) (36)
Various liabilities and other (303) (238)
Gross deferred tax assets (751) (580)
Deferred tax asset valuation allowances 137 130
Net deferred tax assets (614) (450)
Net deferred tax (assets) liabilities $ (309) $ (245)
Reported in Consolidated Balance Sheets as:
Deferred income tax assets $(121) $ (79)
Other assets (222) (166)
Accounts payable and other current liabilities 34
—
$ (309) $ (245)
A determination of the unrecognized deferred tax liability for
temporary differences related to our investments in foreign sub-
sidiaries and investments in foreign unconsolidated affiliates that
are essentially permanent in duration is not practicable.
We have available net operating loss and tax credit carryfor-
wards totaling approximately $1.3 billion at December 28, 2002 to
reduce future tax of YUM and certain subsidiaries. The carryfor-
wards are related to a number of foreign and state jurisdictions.
Of these carryforwards, $4 million expire in 2003 and $1.1 billion
expire at various times between 2004 and 2020. The remaining
carryforwards of approximately $179 million do not expire.
REPORTABLE OPERATING SEGMENTS
We are principally engaged in developing, operating, franchising
and licensing the worldwide KFC, Pizza Hut and Taco Bell concepts,
and since May 7, 2002, the LJS and A&W concepts, which were
added when we acquired YGR. KFC, Pizza Hut, Taco Bell, LJS and
A&W operate throughout the U.S. and in 88, 85, 12, 5 and 17 coun-
tries and territories outside the U.S., respectively. Our five largest
international markets based on operating profit in 2002 are China,
United Kingdom, Canada, Australia and Korea. At December 28,
2002, we had investments in 10 unconsolidated affiliates outside
the U.S. which operate principally KFC and/or Pizza Hut restau-
rants. These unconsolidated affiliates operate in Canada, China,
NOTE
23
Japan, Poland and the United Kingdom. Additionally, we had an
investment in an unconsolidated affiliate in the U.S. which oper-
ates Yan Can restaurants.
We identify our operating segments based on management
responsibility within the U.S. and International. For purposes of
applying SFAS No. 131, “Disclosure About Segments of An
Enterprise and Related Information” (“SFAS 131”), we consider LJS
and A&W to be a single segment. We consider our KFC, Pizza Hut,
Taco Bell and LJS/A&W operating segments to be similar and
therefore have aggregated them into a single reportable operat-
ing segment. Within our International operating segment, no
individual country was considered material under the SFAS 131
requirements related to information about geographic areas and
therefore, none have been reported separately.
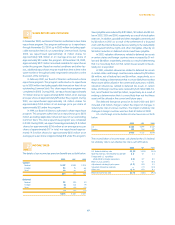
Revenues
2002 2001 2000
United States $ 5,347 $ 4,827 $ 5,062
International 2,410 2,126 2,031
$7,757 $ 6,953 $ 7,093
Operating Profit; Interest
Expense, Net; and Income
Before Income Taxes
2002 2001 2000
United States $825 $ 722 $ 742
International(a) 389 318 309
Unallocated and corporate expenses (178) (148) (163)
Unallocated other income (expense) (1) (3) —
Facility actions net (loss) gain(b) (32) (1) 176
Unusual items income (expense)(b) 27 3 (204)
Total operating profit 1,030 891 860
Interest expense, net (172) (158) (176)
Income before income taxes $858 $ 733 $ 684
Depreciation and Amortization
2002 2001 2000
United States $228 $ 224 $ 231
International 122 117 110
Corporate 20 13 13
$ 370 $ 354 $ 354
Capital Spending
2002 2001 2000
United States $453 $ 392 $ 370
International 295 232 192
Corporate 12 12 10
$ 760 $ 636 $ 572
Identifiable Assets
2002 2001 2000
United States $ 3,285 $ 2,521 $ 2,400
International(c) 1,732 1,598 1,501
Corporate(d) 383 306 248
$ 5,400 $ 4,425 $ 4,149
68.