Pizza Hut 2002 Annual Report Download - page 36
Download and view the complete annual report
Please find page 36 of the 2002 Pizza Hut annual report below. You can navigate through the pages in the report by either clicking on the pages listed below, or by using the keyword search tool below to find specific information within the annual report.-
 1
1 -
2
-
3
-
4
-
5
-
6
-
7
-
8
-
9
-
10
-
11
-
12
-
13
-
14
-
15
-
16
-
17
-
18
-
19
-
20
-
21
-
22
-
23
-
24
-
25
-
 26
26 -
 27
27 -
 28
28 -
 29
29 -
 30
30 -
 31
31 -
 32
32 -
 33
33 -
 34
34 -
 35
35 -
 36
36 -
 37
37 -
 38
38 -
 39
39 -
 40
40 -
 41
41 -
 42
42 -
 43
43 -
 44
44 -
 45
45 -
 46
46 -
47
-
48
-
49
-
50
-
51
-
52
-
53
-
54
-
55
-
56
-
57
-
58
-
59
-
60
-
61
-
62
-
63
-
64
-
65
-
66
-
67
-
68
-
69
-
70
-
71
-
72
-
73
-
74
-
75
-
76
-
77
-
78
-
79
-
80
 |
 |

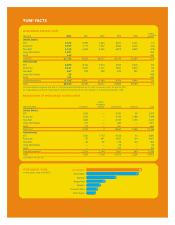
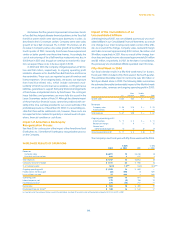
WORLDWIDE SYSTEM SALES
System sales represents the combined sales of Company, uncon-
solidated affiliates, franchise and license restaurants. Sales of
unconsolidated affiliates and franchise and license restaurants
result in franchise and license fees for us but are not included in
the Company sales figure we present on the Consolidated
Statements of Income. However, we believe that system sales is
useful to investors as a significant indicator of our Concepts’ mar-
ket share and the overall strength of our business as it
incorporates all of our revenue drivers
,
company and franchise
same store sales as well as net unit development.
% B(W) % B(W)
2002 vs. 2001 2001 vs. 2000
System sales $ 24,219 8 $ 22,328 1
System sales increased approximately $1,891 million or 8% in
2002. The impact from foreign currency translation was not sig-
nificant. Excluding the favorable impact of the YGR acquisition,
system sales increased 5%. The increase resulted from new unit
development and same store sales growth, partially offset by
store closures.
System sales increased $169 million or 1% in 2001, after a 2%
unfavorable impact from foreign currency translation. Excluding
the unfavorable impact of foreign currency translation and lap-
ping the fifty-third week in 2000, system sales increased 5%. This
increase was driven by new unit development and same store
sales growth, partially offset by store closures.
WORLDWIDE REVENUES
Company sales increased $753 million or 12% in 2002. The impact
from foreign currency translation was not significant. Excluding the
favorable impact of the YGR acquisition, Company sales increased
6%. The increase was driven by new unit development and same
store sales growth. The increase was partially offset by refran-
chising and store closures.
Company sales decreased $167 million or 3% in 2001, after a
2% unfavorable impact from foreign currency translation. Excluding
the unfavorable impact of foreign currency translation and lapping
the fifty-third week in 2000, Company sales were flat. An increase
due to new unit development was offset by refranchising.
Franchise and license fees increased $51 million or 6% in
2002. The impact from foreign currency translation was not sig-
nificant. Excluding the favorable impact of the YGR acquisition,
franchise and license fees increased 4%. The increase was driven
by new unit development and same store sales growth, partially
offset by store closures.
Franchise and license fees increased $27 million or 3% in
2001, after a 2% unfavorable impact from foreign currency trans-
lation. Excluding the unfavorable impact of foreign currency
translation and lapping the fifty-third week in 2000, franchise and
license fees increased 7%. The increase was driven by new unit
development, units acquired from us and same store sales
growth. This increase was partially offset by store closures.
34.
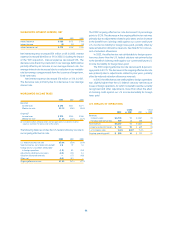
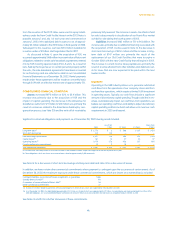
WORLDWIDE RESTAURANT UNIT ACTIVITY
Unconsolidated
Company Affiliates Franchisees Licensees Total
Balance at Dec. 30, 2000 6,123 1,844 19,287 3,163 30,417
New Builds 521 150 818 190 1,679
Acquisitions 361 (28) (328) (5)
—
Refranchising (233) (20) 253
——
Closures (270) (39) (741) (557) (1,607)
Other(a) (67) 93 (26)
——
Balance at Dec. 29, 2001 6,435 2,000 19,263 2,791 30,489
New Builds 585 165 748 146 1,644
Acquisitions(b) 905 41 1,164 (3) 2,107
Refranchising (174) (14) 188
——
Closures (224) (46) (649) (409) (1,328)
Other (1) 2 10 1 12
Balance at Dec. 28, 2002 7,526 2,148 20,724 2,526 32,924
% of Total 23% 6% 63% 8% 100%
(a) Primarily includes 52 Company stores and 41 franchisee stores contributed to an unconsolidated affiliate in 2001.
(b) Includes units that existed at the date of the acquisition of YGR on May 7, 2002.