Pizza Hut 2002 Annual Report Download - page 43
Download and view the complete annual report
Please find page 43 of the 2002 Pizza Hut annual report below. You can navigate through the pages in the report by either clicking on the pages listed below, or by using the keyword search tool below to find specific information within the annual report.-
 1
1 -
2
-
3
-
4
-
5
-
6
-
7
-
8
-
9
-
10
-
11
-
12
-
13
-
14
-
15
-
16
-
17
-
18
-
19
-
20
-
21
-
22
-
23
-
24
-
25
-
26
-
27
-
28
-
29
-
30
-
31
-
32
-
 33
33 -
 34
34 -
 35
35 -
 36
36 -
 37
37 -
 38
38 -
 39
39 -
 40
40 -
 41
41 -
 42
42 -
 43
43 -
 44
44 -
 45
45 -
 46
46 -
 47
47 -
 48
48 -
 49
49 -
 50
50 -
 51
51 -
 52
52 -
 53
53 -
54
-
55
-
56
-
57
-
58
-
59
-
60
-
61
-
62
-
63
-
64
-
65
-
66
-
67
-
68
-
69
-
70
-
71
-
72
-
73
-
74
-
75
-
76
-
77
-
78
-
79
-
80
 |
 |

from the issuance of the 2012 Notes were used to repay indebt-
edness under the New Credit Facility. Interest on the 2012 Notes is
payable January 1 and July 1 of each year and commenced on
January 1, 2003. We capitalized debt issuance costs of approxi-
mately $5 million related to the 2012 Notes in third quarter of 2002.
Subsequent to this issuance, we have $150 million available for
issuance under a $2 billion shelf registration filed in 1997.
As discussed in Note 4, upon the acquisition of YGR, we
assumed approximately $168 million in present value of future rent
obligations related to certain sale-leaseback agreements entered
into by YGR involving approximately 350 LJS units. As a result of
liens held by the buyer/lessor on certain personal property within
the units, the sale-leaseback agreements have been accounted
for as financings and are reflected as debt in our Consolidated
Financial Statements as of December 28, 2002. Rental payments
made under these agreements will be made on a monthly basis
through 2019 with an effective interest rate of approximately 11%.
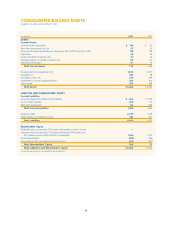
CONSOLIDATED FINANCIAL CONDITION
Assets increased $975 million or 22% to $5.4 billion. This
increase was primarily due to the acquisition of YGR and the
impact of capital spending. The decrease in the allowance for
doubtful accounts from $77 million to $42 million was primarily the
result of recoveries related to the AmeriServe bankruptcy reor-
ganization process (see Note 25) and the write-off of receivables
previously fully reserved. The increase in assets classified as held
for sale is due primarily to classification of our Puerto Rico market
as held for sale during the fourth quarter of 2002.
Liabilities increased $485 million or 11% to $4.8 billion. The
increase was primarily due to additional financing associated with
the acquisition of YGR. As discussed in Note 14, the decrease in
short-term borrowings of $550 million and the increase in long-
term debt of $747 million are primarily the result of the
replacement of our Old Credit Facilities that were to expire in
October 2002 with the New Credit Facility that will expire in 2005.
The increase in current income taxes payable was primarily the
result of a reclassification from other liabilities and deferred cred-
its for taxes that are now expected to be paid within the next
twelve months.
LIQUIDITY
Operating in the QSR industry allows us to generate substantial
cash flows from the operations of our company stores and from
our franchise operations, which require a limited YUM investment
in operating assets. Typically, our cash flows include a significant
amount of discretionary capital spending. Though a decline in rev-
enues could adversely impact our cash flows from operations, we
believe our operating cash flows and ability to adjust discretionary
capital spending and borrow funds will allow us to meet our cash
requirements in 2003 and beyond.
41.
Yum! Brands Inc.
Significant contractual obligations and payments as of December 28, 2002 due by period included:
Less than More than
Total 1 Year 1-3 Years 3-5 Years 5 Years
Long-term debt(a) $ 2,173 $ 2 $ 508 $ 207 $ 1,456
Short-term borrowings 134 134
———
Debt excluding capital leases 2,307 136 508 207 1,456
Capital leases(b) 181 14 27 23 117
Operating leases(b) 1,974 276 456 337 905
Franchisee financing commitments 19 9 10
——
Total contractual obligations $ 4,481 $ 435 $ 1,001 $ 567 $ 2,478
(a) Excludes a fair value adjustment of $44 million included in debt related to interest swaps that hedge the fair value of a portion of our debt.
(b) These obligations, which are shown on a nominal basis, relate to approximately 5,600 restaurants.
See Note 14 for a discussion of short-term borrowings and long-term debt and Note 15 for a discussion of leases.
In addition, we have certain other commercial commitments where payment is contingent upon the occurrence of certain events. As of
December 28, 2002, the maximum exposure under these commercial commitments, which are shown on a nominal basis, included:
Contingent liabilities associated with lease assignments or guarantees $388
Standby letters of credit(a) 193
Guarantees of unconsolidated affiliates’ debt(b) 26
Other commercial commitments 27
(a) Includes $32 million related to guarantees of financial arrangements of franchisees, which are supported by stand-by letters of credit.
(b) As of December 28, 2002, this debt totaled approximately $152 million, our share of which was approximately $77 million. As noted above, we have guaranteed $26 million of this
total debt obligation. Our unconsolidated affiliates had total assets of over $1 billion as of year-end 2002 and total revenues of approximately $1.8 billion in 2002.
See Notes 14 and 24 for a further discussion of these commitments.