Pizza Hut 2002 Annual Report Download - page 27
Download and view the complete annual report
Please find page 27 of the 2002 Pizza Hut annual report below. You can navigate through the pages in the report by either clicking on the pages listed below, or by using the keyword search tool below to find specific information within the annual report.-
 1
1 -
2
-
3
-
4
-
5
-
6
-
7
-
8
-
9
-
10
-
11
-
12
-
13
-
14
-
15
-
16
-
 17
17 -
 18
18 -
 19
19 -
 20
20 -
 21
21 -
 22
22 -
 23
23 -
 24
24 -
 25
25 -
 26
26 -
 27
27 -
 28
28 -
 29
29 -
 30
30 -
 31
31 -
 32
32 -
 33
33 -
 34
34 -
 35
35 -
 36
36 -
 37
37 -
38
-
39
-
40
-
41
-
42
-
43
-
44
-
45
-
46
-
47
-
48
-
49
-
50
-
51
-
52
-
53
-
54
-
55
-
56
-
57
-
58
-
59
-
60
-
61
-
62
-
63
-
64
-
65
-
66
-
67
-
68
-
69
-
70
-
71
-
72
-
73
-
74
-
75
-
76
-
77
-
78
-
79
-
80
 |
 |

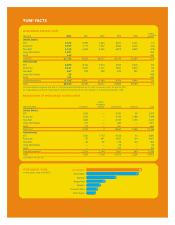
25.
U.S. Sales by Daypart
(% of Traffic)
U.S. Sales by Distribution
Channel (% of Traffic)
•Dinner 54% •Lunch 37%
•Snacks/Breakfast 9%
•Dinner 62% •Lunch 26%
•Snacks/Breakfast 12%
•Dinner 41% •Lunch 44%
•Snacks/Breakfast 15%
•Dinner 50% •Lunch 50%
•Dinner 26% •Lunch 47%
•Snacks/Breakfast 27%
•Dine Out 80%
•Dine In 20%
•Dine Out 74%
•Dine In 26%
•Dine Out 74%
•Dine In 26%
•Dine Out 58%
•Dine In 42%
•Dine Out 48%
•Dine In 52%
Sources of System
Sales in International
Restaurants*
•Asia-Pacific 40%
•Europe, South Africa 25%
•Americas 20%
•Greater China 15%
YUM! AT-A-GLANCE
SOURCE: CREST
* System sales represents the combined sales of Company,
unconsolidated affiliates, franchise and license restaurants.
TM
®
®