Pizza Hut 2002 Annual Report Download - page 4
Download and view the complete annual report
Please find page 4 of the 2002 Pizza Hut annual report below. You can navigate through the pages in the report by either clicking on the pages listed below, or by using the keyword search tool below to find specific information within the annual report.-
 1
1 -
 2
2 -
 3
3 -
 4
4 -
 5
5 -
 6
6 -
 7
7 -
 8
8 -
 9
9 -
 10
10 -
 11
11 -
 12
12 -
 13
13 -
 14
14 -
 15
15 -
16
-
17
-
18
-
19
-
20
-
21
-
22
-
23
-
24
-
25
-
26
-
27
-
28
-
29
-
30
-
31
-
32
-
33
-
34
-
35
-
36
-
37
-
38
-
39
-
40
-
41
-
42
-
43
-
44
-
45
-
46
-
47
-
48
-
49
-
50
-
51
-
52
-
53
-
54
-
55
-
56
-
57
-
58
-
59
-
60
-
61
-
62
-
63
-
64
-
65
-
66
-
67
-
68
-
69
-
70
-
71
-
72
-
73
-
74
-
75
-
76
-
77
-
78
-
79
-
80
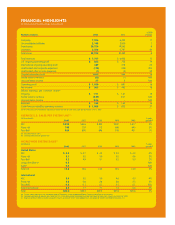
 |
 |

% B(W)
Number of stores: 2002 2001 change
Company 7,526 6,435 17
Unconsolidated affiliates 2,148 2,000 7
Franchisees 20,724 19,263 8
Licensees 2,526 2,791 (9)
Total stores 32,924 30,489 8
Total revenues $ 7,757 $ 6,953 12
U.S. ongoing operating profit $ 825 $ 722 14
International ongoing operating profit 389 318 22
Unallocated and corporate expenses (178) (148) (20)
Unallocated other income (expense) (1) (3) 59
Ongoing operating profit 1,035 889 16
Facility actions net (loss) (32) (1) NM
Unusual items income 27 3NM
Operating profit $ 1,030 $ 891 16
Net income $ 583 $ 492 18
Diluted earnings per common share(a):
Ongoing $ 1.91 $1.61 19
Facility actions net (loss) (0.09) 0.01 NM
Unusual items income 0.06 –NM
Reported $ 1.88 $ 1.62 16
Cash flows provided by operating activities $ 1,088 $832 31
(a) Per share amounts have been adjusted to reflect the two-for-one stock split distributed on June 17, 2002.
AVERAGE U.S. SALES PER SYSTEM UNIT(a)
(in thousands) 5-year
2002 2001 2000 1999 1998 growth(b)
KFC $ 898 $ 865 $ 833 $ 837 $ 817 3%
Pizza Hut 748 724 712 696 645 3%
Taco Bell 964 890 896 918 931 1%
(a) Excludes license units.
(b) Compounded annual growth rate.
WORLDWIDE SYSTEM SALES(a)
(in billions) 5-year
2002 2001 2000 1999 1998 growth(b)
United States
KFC $ 4.8 $ 4.7 $ 4.4 $ 4.3 $ 4.2 4%
Pizza Hut 5.1 5.0 5.0 5.0 4.8 2%
Taco Bell 5.2 4.9 5.1 5.2 5.0 2%
Long John Silver’s(c) 0.5 NM
A&W(c) 0.2 NM
Total U.S. 15.8 14.6 14.5 14.5 14.0 2%
International
KFC 5.4 5.0 5.0 4.6 4.0 4%
Pizza Hut 2.8 2.6 2.6 2.6 2.5 2%
Taco Bell 0.2 0.1 0.1 0.1 0.1 10%
Total International 8.4 7.7 7.7 7.3 6.6 4%
Total $24.2 $22.3 $22.2 $21.8 $20.6 3%
(a) System sales represents the combined sales of Company, unconsolidated affiliates, franchise and license restaurants.
(b) Compounded annual growth rate; Totals for U.S., International and Worldwide exclude the impact of Long John Silver’s and A&W for 2002.
(c) Beginning May 7, 2002, includes Long John Silver’s and A&W, which were added when we acquired Yorkshire Global Restaurants, Inc.
FINANCIAL HIGHLIGHTS
(in millions, except for store and per share amounts)