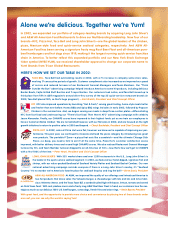
Pizza Hut 2002 Annual Report Download - page 38
Download and view the complete annual report
Please find page 38 of the 2002 Pizza Hut annual report below. You can navigate through the pages in the report by either clicking on the pages listed below, or by using the keyword search tool below to find specific information within the annual report.-
 1
1 -
2
-
3
-
4
-
5
-
6
-
7
-
8
-
9
-
10
-
11
-
12
-
13
-
14
-
15
-
16
-
17
-
18
-
19
-
20
-
21
-
22
-
23
-
24
-
25
-
26
-
27
-
 28
28 -
 29
29 -
 30
30 -
 31
31 -
 32
32 -
 33
33 -
 34
34 -
 35
35 -
 36
36 -
 37
37 -
 38
38 -
 39
39 -
 40
40 -
 41
41 -
 42
42 -
 43
43 -
 44
44 -
 45
45 -
 46
46 -
 47
47 -
 48
48 -
49
-
50
-
51
-
52
-
53
-
54
-
55
-
56
-
57
-
58
-
59
-
60
-
61
-
62
-
63
-
64
-
65
-
66
-
67
-
68
-
69
-
70
-
71
-
72
-
73
-
74
-
75
-
76
-
77
-
78
-
79
-
80
 |
 |

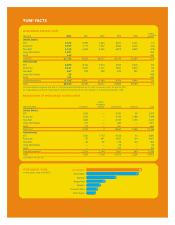
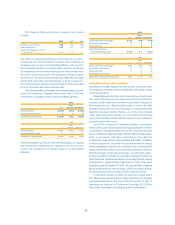
36.
WORLDWIDE INTEREST EXPENSE, NET
2002 2001 2000
Interest expense $ 180 $ 172 $ 190
Interest income (8) (14) (14)
Interest expense, net $ 172 $ 158 $ 176
Net interest expense increased $14 million or 8% in 2002. Interest
expense increased $8 million or 5% in 2002. Excluding the impact
of the YGR acquisition, interest expense decreased 12%. The
decrease was driven by a reduction in our average debt balance
partially offset by an increase in our average interest rate. Our
average interest rate increased due to a reduction in our variable-
rate borrowings using proceeds from the issuance of longer term,
fixed-rate notes.
Net interest expense decreased $18 million or 10% in 2001.
The decrease was primarily due to a decrease in our average
interest rate.
WORLDWIDE INCOME TAXES
2002 2001 2000
Reported
Income taxes $ 275 $ 241 $ 271
Effective tax rate 32.1% 32.8% 39.6%
Ongoing(a)
Income taxes $ 270 $ 243 $ 268
Effective tax rate 31.3% 33.1% 37.7%
(a) Excludes the effects of facility actions net loss (gain) and unusual items (income)
expense. See Note 7 for a discussion of these items.
The following table reconciles the U.S. federal statutory tax rate to
our ongoing effective tax rate:
2002 2001 2000
U.S. federal statutory tax rate 35.0% 35.0% 35.0%
State income tax, net of federal tax benefit 2.0 1.9 1.8
Foreign and U.S. tax effects attributable
to foreign operations (1.9) 0.2 (0.4)
Adjustments relating to prior years (3.5) (2.2) 5.3
Valuation allowance reversals
—
(1.7) (4.0)
Other, net (0.3) (0.1)
—
Ongoing effective tax rate 31.3% 33.1% 37.7%
The 2002 ongoing effective tax rate decreased 1.8 percentage
points to 31.3%. The decrease in the ongoing effective tax rate was
primarily due to adjustments related to prior years and an increase
in the benefit from claiming credit against our current and future
U.S. income tax liability for foreign taxes paid, partially offset by
reduced valuation allowance reversals. See Note 22 for a discus-
sion of valuation allowances.
In 2002, the effective tax rate attributable to foreign opera-
tions was lower than the U.S. federal statutory rate primarily due
to the benefit of claiming credit against our current and future U.S.
income tax liability for foreign taxes paid.
The 2001 ongoing effective tax rate decreased 4.6 percent-
age points to 33.1%. The decrease in the ongoing effective tax rate
was primarily due to adjustments related to prior years, partially
offset by reduced valuation allowance reversals.
In 2001, the effective tax rate attributable to foreign operations
was slightly higher than the U.S. federal statutory rate because
losses of foreign operations for which no benefit could be currently
recognized and other adjustments more than offset the effect
of claiming credit against our U.S. income tax liability for foreign
taxes paid.
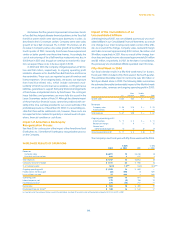
U.S. RESULTS OF OPERATIONS
% B(W) % B(W)
2002 vs. 2001 2001 vs. 2000
Revenues
Company sales $ 4,778 11 $ 4,287 (5)
Franchise and license fees 569 5 540 2
Total revenues $ 5,347 11 $ 4,827 (5)
Company restaurant margin $ 764 18 $ 649 (5)
% of Company sales 16.0% 0.8ppts. 15.2%
—
Ongoing operating profit $ 825 14 $ 722 (3)