Pizza Hut 2002 Annual Report Download - page 33
Download and view the complete annual report
Please find page 33 of the 2002 Pizza Hut annual report below. You can navigate through the pages in the report by either clicking on the pages listed below, or by using the keyword search tool below to find specific information within the annual report.-
 1
1 -
2
-
3
-
4
-
5
-
6
-
7
-
8
-
9
-
10
-
11
-
12
-
13
-
14
-
15
-
16
-
17
-
18
-
19
-
20
-
21
-
22
-
 23
23 -
 24
24 -
 25
25 -
 26
26 -
 27
27 -
 28
28 -
 29
29 -
 30
30 -
 31
31 -
 32
32 -
 33
33 -
 34
34 -
 35
35 -
 36
36 -
 37
37 -
 38
38 -
 39
39 -
 40
40 -
 41
41 -
 42
42 -
 43
43 -
44
-
45
-
46
-
47
-
48
-
49
-
50
-
51
-
52
-
53
-
54
-
55
-
56
-
57
-
58
-
59
-
60
-
61
-
62
-
63
-
64
-
65
-
66
-
67
-
68
-
69
-
70
-
71
-
72
-
73
-
74
-
75
-
76
-
77
-
78
-
79
-
80
 |
 |

FACTORS AFFECTING COMPARABILITY
OF 2002 RESULTS TO 2001 RESULTS AND
2001 RESULTS TO 2000 RESULTS
YGR Acquisition
On May 7, 2002, the Company completed its acquisition of YGR,
the parent company of LJS and A&W. See Note 4 for a discussion
of the acquisition.
As of the date of the acquisition, YGR consisted of 742 and
496 company and franchise LJS units, respectively, and 127 and
742 company and franchise A&W units, respectively. In addition,
133 multibranded LJS/A&W restaurants were included in the LJS
unit totals. Except as discussed in certain sections of the MD&A,
the impact of the acquisition on our results of operations in 2002
was not significant.
Impact of Recently Adopted Accounting
Pronouncement
Effective December 30, 2001, the Company adopted Statement of
Financial Accounting Standards (“SFAS”) No. 142, “Goodwill and
Other Intangible Assets” (“SFAS 142”), in its entirety. In accordance
with the requirements of SFAS 142, we ceased amortization of
goodwill and indefinite-lived intangibles as of December 30, 2001.
The following table summarizes the favorable effect of SFAS 142
on restaurant profit, restaurant margin and ongoing operating
profit had SFAS 142 been effective in 2001.
Year Ended December 29, 2001
Inter-
U.S. national Worldwide
Restaurant profit $21 $11 $32
Restaurant margin (%) 0.5 0.6 0.5
Ongoing operating profit $22 $16 $38
Additionally, if SFAS 142 had been effective in 2001, reported net
income would have increased approximately $26 million and diluted
earnings per common share (“EPS”) would have increased $0.09.
Unusual Items (Income) Expense
We recorded unusual items income of $27 million in 2002 and
$3 million in 2001 and unusual items expense of $204 million in
2000. See Note 7 for a detailed discussion of our unusual items
(income) expense.
Impact of New Unconsolidated Affiliates
Consistent with our strategy to focus our capital on key interna-
tional markets, we formed ventures in Canada and Poland with
our largest franchisee in each market. The venture in Canada was
formed in the third quarter of 2000 and the venture in Poland was
effective in the first quarter of 2001. At the date of formation, the
Canadian venture operated over 700 stores and the Poland ven-
ture operated approximately 100 stores. We did not record any
gain or loss on the transfer of assets to these new ventures.
Previously, the results from the restaurants we contributed to
these ventures were consolidated. The impact of these trans-
actions on operating results is similar to the impact of our
refranchising activities, which is described in the Store Portfolio
Strategy section below. Consequently, these transactions resulted
in a decline in our Company sales, restaurant margin dollars and
general and administrative (“G&A”) expenses as well as higher
franchise fees. We also record equity income (loss) from invest-
ments in unconsolidated affiliates (“equity income”) and, in
Canada, higher franchise fees since the royalty rate was increased
for those stores contributed by our partner to the venture. The for-
mation of these ventures did not have a significant net impact on
ongoing operating profit in 2001.
Store Portfolio Strategy
Since 1995, we have been strategically reducing our share of
total system units by selling Company restaurants to existing and
new franchisees where their expertise can generally be lever-
aged to improve the restaurants’ overall operating performance,
while retaining Company ownership of key U.S. and International
markets. This portfolio-balancing activity reduces our reported
revenues and restaurant profits, which increases the importance
of system sales as a key performance measure. We substantially
completed our U.S. refranchising program in 2001.
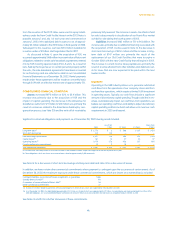
The following table summarizes our refranchising activities:
2002 2001 2000
Number of units refranchised 174 233 757
Refranchising proceeds, pre-tax $81 $ 111 $ 381
Refranchising net gains, pre-tax(a) $19 $ 39 $ 200
(a) 2001 includes $12 million of previously deferred refranchising gains and a charge of
$11 million to mark to market the net assets of our Singapore business, which was
sold during 2002 at a price approximately equal to its carrying value.
In addition to our refranchising program, we have closed certain
restaurants over the past several years. Restaurants closed include
poor performing restaurants, restaurants relocated to a new site
within the same trade area or U.S. Pizza Hut delivery units con-
solidated with a new or existing dine-in traditional store within the
same trade area.
31.
Yum! Brands Inc.