Pizza Hut 2002 Annual Report Download - page 39
Download and view the complete annual report
Please find page 39 of the 2002 Pizza Hut annual report below. You can navigate through the pages in the report by either clicking on the pages listed below, or by using the keyword search tool below to find specific information within the annual report.-
 1
1 -
2
-
3
-
4
-
5
-
6
-
7
-
8
-
9
-
10
-
11
-
12
-
13
-
14
-
15
-
16
-
17
-
18
-
19
-
20
-
21
-
22
-
23
-
24
-
25
-
26
-
27
-
28
-
 29
29 -
 30
30 -
 31
31 -
 32
32 -
 33
33 -
 34
34 -
 35
35 -
 36
36 -
 37
37 -
 38
38 -
 39
39 -
 40
40 -
 41
41 -
 42
42 -
 43
43 -
 44
44 -
 45
45 -
 46
46 -
 47
47 -
 48
48 -
 49
49 -
50
-
51
-
52
-
53
-
54
-
55
-
56
-
57
-
58
-
59
-
60
-
61
-
62
-
63
-
64
-
65
-
66
-
67
-
68
-
69
-
70
-
71
-
72
-
73
-
74
-
75
-
76
-
77
-
78
-
79
-
80
 |
 |

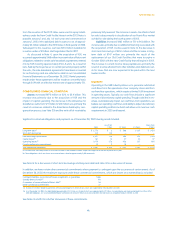
37.
Yum! Brands Inc.
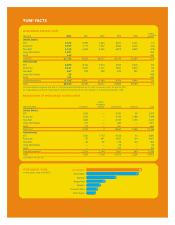
U.S. RESTAURANT UNIT ACTIVITY
Unconsolidated
Company Affiliates(a) Franchisees Licensees Total
Balance at Dec. 30, 2000 4,302
—
12,862 2,873 20,037
New Builds 183
—
265 182 630
Acquisitions 136
—
(133) (3)
—
Refranchising (155)
—
155
——
Closures (182)
—
(416) (507) (1,105)
Balance at Dec. 30, 2001 4,284
—
12,733 2,545 19,562
New Builds 210 4 233 136 583
Acquisitions(b) 899
—
1,001 (3) 1,897
Refranchising (47)
—
47
——
Closures (153)
—
(351) (382) (886)
Other(c)
———
(30) (30)
Balance at Dec. 28, 2002 5,193 4 13,663 2,266 21,126
% of Total 24%
—
65% 11% 100%
(a) Represents 4 Yan Can units.
(b) Includes units that existed at the date of the acquisition of YGR on May 7, 2002.
(c) Represents licensee units transferred from U.S. to International.
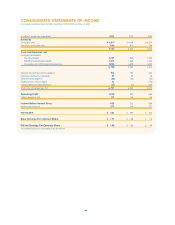
U.S. SYSTEM SALES
% B(W) % B(W)
2002 vs. 2001 2001 vs. 2000
System sales $ 15,839 9 $ 14,596 1
System sales increased approximately $1,243 million or 9% in 2002.
Excluding the favorable impact of the YGR acquisition, system sales
increased 4%. The increase resulted from same store sales growth
and new unit development, partially offset by store closures.
System sales increased $82 million or 1% in 2001. Excluding
the unfavorable impact of lapping the fifty-third week in 2000, sys-
tem sales increased 2%. The increase was driven by new unit
development and same store sales growth at KFC and Pizza Hut,
partially offset by store closures.
U.S. REVENUES
Company sales increased $491 million or 11% in 2002. Excluding
the favorable impact of the YGR acquisition, company sales
increased 3%. The increase was driven by new unit development
and same store sales growth. The increase was partially offset by
store closures and refranchising.
For 2002, blended Company same store sales for KFC, Pizza
Hut and Taco Bell were up 2% due to increases in both transac-
tions and average guest check. Same store sales at Taco Bell
increased 7%, primarily driven by a 4% increase in transactions.
Same store sales at both Pizza Hut and KFC were flat due to a 2%
increase in average guest check offset by transaction declines.
Company sales decreased $246 million or 5% in 2001.
Excluding the unfavorable impact of lapping the fifty-third week in
2000, Company sales decreased 4%. The decrease was driven by
refranchising, partially offset by new unit development.
For 2001, blended Company same store sales for KFC, Pizza
Hut and Taco Bell were up 1% on a comparable fifty-two week
basis. An increase in the average guest check was partially offset
by transaction declines. Same store sales at KFC were up 3%, pri-
marily due to an increase in transactions. Same store sales at both
Pizza Hut and Taco Bell were flat. A 2% increase in the average
guest check at Pizza Hut and a 3% increase in the average guest
check at Taco Bell were both offset by transaction declines.
Franchise and license fees increased $29 million or 5% in
2002. Excluding the favorable impact of the YGR acquisition, fran-
chise and license fees increased 3%. The increase was driven by
same store sales growth and new unit development, partially off-
set by store closures.
Franchise and license fees grew $11 million or 2% in 2001.
Excluding the unfavorable impact of lapping the fifty-third week
in 2000, franchise and license fees increased 4%. The increase
was driven by units acquired from us and new unit development,
partially offset by store closures.