Pizza Hut 2002 Annual Report Download - page 35
Download and view the complete annual report
Please find page 35 of the 2002 Pizza Hut annual report below. You can navigate through the pages in the report by either clicking on the pages listed below, or by using the keyword search tool below to find specific information within the annual report.-
 1
1 -
2
-
3
-
4
-
5
-
6
-
7
-
8
-
9
-
10
-
11
-
12
-
13
-
14
-
15
-
16
-
17
-
18
-
19
-
20
-
21
-
22
-
23
-
24
-
 25
25 -
 26
26 -
 27
27 -
 28
28 -
 29
29 -
 30
30 -
 31
31 -
 32
32 -
 33
33 -
 34
34 -
 35
35 -
 36
36 -
 37
37 -
 38
38 -
 39
39 -
 40
40 -
 41
41 -
 42
42 -
 43
43 -
 44
44 -
 45
45 -
46
-
47
-
48
-
49
-
50
-
51
-
52
-
53
-
54
-
55
-
56
-
57
-
58
-
59
-
60
-
61
-
62
-
63
-
64
-
65
-
66
-
67
-
68
-
69
-
70
-
71
-
72
-
73
-
74
-
75
-
76
-
77
-
78
-
79
-
80
 |
 |

We believe that the general improvement in business trends
at Taco Bell has helped alleviate financial problems in the Taco Bell
franchise system which were due to past downturns in sales. As
described in the U.S. revenues section, Company same-store sales
growth at Taco Bell increased 7% in 2002. This follows an 8%
increase in Company same-store sales growth at Taco Bell in the
fourth quarter of 2001. Generally, franchisees have experienced
similar or better growth over these time frames. Accordingly, the
cost of restructurings of Taco Bell franchise restaurants was less in
2002 than in 2001 and, though we continue to monitor this situa-
tion, we expect these costs to be less again in 2003.
In 2002 and 2001, the Company charged expenses of $8 mil-
lion and $18 million, respectively, to ongoing operating profit
related to allowances for doubtful Taco Bell franchise and license
fee receivables. These costs are reported as part of franchise and
license expenses. On an ongoing basis, we assess our exposure
from franchise-related risks, which include estimated uncol-
lectibility of franchise and license receivables, contingent lease
liabilities, guarantees to support third party financial arrangements
of franchisees and potential claims by franchisees. The contingent
lease liabilities and guarantees are more fully discussed in the
Lease Guarantees section of Note 24. Although the ultimate impact
of these franchise financial issues cannot be predicted with cer-
tainty at this time, we have provided for our current estimate of the
probable exposure as of December 28, 2002. It is reasonably pos-
sible that there will be additional costs; however, these costs are
not expected to be material to quarterly or annual results of oper-
ations, financial condition or cash flows.
Impact of AmeriServe Bankruptcy
Reorganization Process
See Note 25 for a discussion of the impact of the AmeriServe Food
Distribution, Inc. (“AmeriServe”) bankruptcy reorganization process
on the Company.
33.
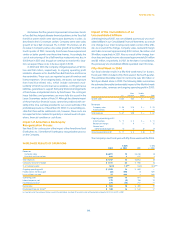
Yum! Brands Inc.
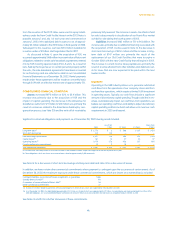
WORLDWIDE RESULTS OF OPERATIONS
% B(W) % B(W)
2002 vs. 2001 2001 vs. 2000
Revenues
Company sales $ 6,891 12 $ 6,138 (3)
Franchise and license fees 866 6 815 3
Total revenues $ 7,757 12 $ 6,953 (2)
Company restaurant margin $ 1,101 22 $ 906 (5)
% of Company sales 16.0% 1.2ppts. 14.8% (0.3)ppts.
Ongoing operating profit $ 1,035 16 $ 889
—
Facility actions net (loss) gain (32) NM (1) NM
Unusual items income 27 NM 3NM
Operating profit 1,030 16 891 4
Interest expense, net 172 (8) 158 10
Income tax provision 275 (15) 241 11
Net income $ 583 18 $ 492 19
Diluted earnings per share(a) $ 1.88 16 $ 1.62 17
(a) See Note 6 for the number of shares used in this calculation. See Note 12 for a discussion of the pro-forma impact of SFAS 142 on EPS in 2001.
Impact of the Consolidation of an
Unconsolidated Affiliate
At the beginning of 2001, we consolidated a previously unconsol-
idated affiliate in our Consolidated Financial Statements as a result
of a change in our intent to temporarily retain control of this affili-
ate. As a result of this change, Company sales, restaurant margin
and G&A increased approximately $100 million, $6 million and
$9 million, respectively, in 2001. Also as a result of the change, fran-
chise fees and equity income decreased approximately $4 million
and $2 million, respectively, in 2001. At the date of consolidation,
this previously unconsolidated affiliate operated over 100 stores.
Fifty-third Week in 2000
Our fiscal calendar results in a fifty-third week every 5 or 6 years.
Fiscal year 2000 included a fifty-third week in the fourth quarter.
The estimated favorable impact in net income was $10 million or
$0.03 per diluted share in 2000. The following table summarizes
the estimated favorable/(unfavorable) impact of the fifty-third week
on system sales, revenues and ongoing operating profit in 2000:
Inter- Unallo-
U.S. national cated Total
System sales $ 230 $ 65 $
—
$ 295
Revenues
Company sales $ 58 $ 18 $
—
$76
Franchise fees 92
—
11
Total revenues $ 67 $ 20 $
—
$87
Ongoing operating profit
Franchise fees $9 $2 $
—
$11
Restaurant margin 11 4
—
15
General and
administrative expenses (3) (2) (2) (7)
Ongoing operating profit $ 17 $ 4 $ (2) $ 19
The Company’s next fiscal year with fifty-three weeks will be 2005.