Pizza Hut 2002 Annual Report Download - page 41
Download and view the complete annual report
Please find page 41 of the 2002 Pizza Hut annual report below. You can navigate through the pages in the report by either clicking on the pages listed below, or by using the keyword search tool below to find specific information within the annual report.-
 1
1 -
2
-
3
-
4
-
5
-
6
-
7
-
8
-
9
-
10
-
11
-
12
-
13
-
14
-
15
-
16
-
17
-
18
-
19
-
20
-
21
-
22
-
23
-
24
-
25
-
26
-
27
-
28
-
29
-
30
-
 31
31 -
 32
32 -
 33
33 -
 34
34 -
 35
35 -
 36
36 -
 37
37 -
 38
38 -
 39
39 -
 40
40 -
 41
41 -
 42
42 -
 43
43 -
 44
44 -
 45
45 -
 46
46 -
 47
47 -
 48
48 -
 49
49 -
 50
50 -
 51
51 -
52
-
53
-
54
-
55
-
56
-
57
-
58
-
59
-
60
-
61
-
62
-
63
-
64
-
65
-
66
-
67
-
68
-
69
-
70
-
71
-
72
-
73
-
74
-
75
-
76
-
77
-
78
-
79
-
80
 |
 |

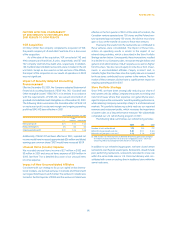
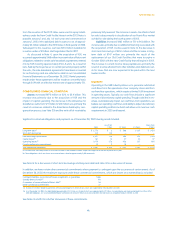
INTERNATIONAL SYSTEM SALES
% B(W) % B(W)
2002 vs. 2001 2001 vs. 2000
System sales $ 8,380 8 $ 7,732 1
System sales increased approximately $648 million or 8% in 2002,
after a 1% unfavorable impact from foreign currency translation.
Excluding the impact of foreign currency translation and the favor-
able impact of the YGR acquisition, system sales increased 8%.
The increase resulted from new unit development and same store
sales growth, partially offset by store closures.
System sales increased approximately $87 million or 1% in
2001, after a 7% unfavorable impact from foreign currency trans-
lation. Excluding the unfavorable impact of foreign currency
translation and lapping the fifty-third week in 2000, system sales
increased 9%. The increase was driven by new unit development
and same store sales growth, partially offset by store closures.
INTERNATIONAL REVENUES
Company sales increased $262 million or 14% in 2002, after a 1%
favorable impact from foreign currency translation. The increase
was driven by new unit development, partially offset by refran-
chising and store closures. The unfavorable impact of refranchising
primarily resulted from the sale of the Singapore business in the
third quarter of 2002.
Company sales increased $79 million or 5% in 2001, after a
5% unfavorable impact from foreign currency translation. Exclud-
ing the unfavorable impact of foreign currency translation and
lapping the fifty-third week in 2000, Company sales increased
11%. The increase was driven by new unit development and acqui-
sitions of restaurants from franchisees. The increase was partially
offset by the contribution of Company stores to new unconsoli-
dated affiliates.
Franchise and license fees increased $22 million or 8% in
2002, after a 1% unfavorable impact from foreign currency trans-
lation. Excluding the impact of foreign currency translation and the
favorable impact of the YGR acquisition, franchise and license fees
increased 8%. The increase was driven by new unit development
and same store sales growth, partially offset by store closures.
Franchise and license fees increased $16 million or 6% in
2001, after a 6% unfavorable impact from foreign currency trans-
lation. Excluding the unfavorable impact of foreign currency
translation and lapping the fifty-third week in 2000, franchise and
license fees increased 13%. The increase was driven by new unit
development, same store sales growth and the contribution of
Company stores to new unconsolidated affiliates. The increase
was partially offset by store closures.
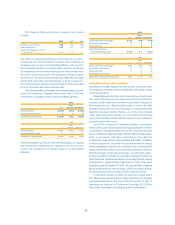
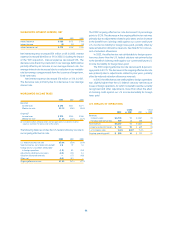
INTERNATIONAL COMPANY RESTAURANT MARGIN
2002 2001 2000
Company sales 100.0% 100.0% 100.0%
Food and paper 36.1 36.9 36.5
Payroll and employee benefits 18.7 19.1 19.5
Occupancy and other operating expenses 29.2 30.1 28.9
Company restaurant margin 16.0% 13.9% 15.1%
Restaurant margin as a percentage of sales increased approxi-
mately 210 basis points in 2002, including the favorable impact of
approximately 60 basis points from the adoption of SFAS 142. The
increase was primarily driven by the favorable impact of lower
restaurant operating costs and the elimination of lower average
margin units through store closures. Lower restaurant operating
costs primarily resulted from lower food and paper costs, partially
offset by higher labor costs.
Restaurant margin as a percentage of sales decreased
approximately 120 basis points in 2001. The decrease was prima-
rily attributable to higher restaurant operating costs and the
acquisition of below average margin stores from franchisees. The
decrease was partially offset by the favorable impact of same
store sales growth.
INTERNATIONAL ONGOING OPERATING PROFIT
Ongoing operating profit increased $71 million or 22% in 2002,
after a 1% unfavorable impact from foreign currency translation.
Excluding the impact of foreign currency translation and the favor-
able impact from the adoption of SFAS 142, ongoing operating profit
increased 17%. The increase was driven by new unit development
and the favorable impact of lower restaurant operating costs, pri-
marily lower cost of food and paper. The increase was partially
offset by higher G&A expenses, primarily compensation-related
costs.
Ongoing operating profit increased $9 million or 3% in 2001,
after a 7% unfavorable impact from foreign currency translation.
Excluding the unfavorable impact of foreign currency translation
and lapping the fifty-third week in 2000, ongoing operating profit
increased 12%. The increase was driven by new unit development
and same store sales growth, partially offset by higher restaurant
operating costs.
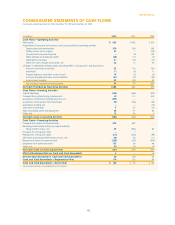
CONSOLIDATED CASH FLOWS
Net cash provided by operating activities was $1,088 mil-
lion compared to $832 million in 2001. Excluding the impact of the
AmeriServe bankruptcy reorganization process, cash provided by
operating activities was $1,043 million versus $704 million in 2001.
This increase was primarily driven by higher operating profit and
timing of tax receipts and payments.
39.
Yum! Brands Inc.