Pizza Hut 2002 Annual Report Download - page 56
Download and view the complete annual report
Please find page 56 of the 2002 Pizza Hut annual report below. You can navigate through the pages in the report by either clicking on the pages listed below, or by using the keyword search tool below to find specific information within the annual report.-
 1
1 -
2
-
3
-
4
-
5
-
6
-
7
-
8
-
9
-
10
-
11
-
12
-
13
-
14
-
15
-
16
-
17
-
18
-
19
-
20
-
21
-
22
-
23
-
24
-
25
-
26
-
27
-
28
-
29
-
30
-
31
-
32
-
33
-
34
-
35
-
36
-
37
-
38
-
39
-
40
-
41
-
42
-
43
-
44
-
45
-
 46
46 -
 47
47 -
 48
48 -
 49
49 -
 50
50 -
 51
51 -
 52
52 -
 53
53 -
 54
54 -
 55
55 -
 56
56 -
 57
57 -
 58
58 -
 59
59 -
 60
60 -
 61
61 -
 62
62 -
 63
63 -
 64
64 -
 65
65 -
 66
66 -
67
-
68
-
69
-
70
-
71
-
72
-
73
-
74
-
75
-
76
-
77
-
78
-
79
-
80
 |
 |

Liabilities assumed included approximately $48 million of
bank indebtedness that was paid off prior to the end of the
second quarter of 2002 and approximately $11 million in capital
lease obligations. We also assumed approximately $168 million
in present value of future rent obligations related to existing
sale-leaseback agreements entered into by YGR involving approx-
imately 350 LJS units. As a result of liens held by the buyer/lessor
on certain personal property within the units, the sale-leaseback
agreements have been accounted for as financings and reflected
as debt.
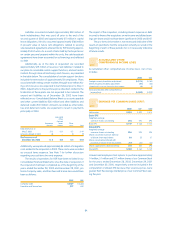
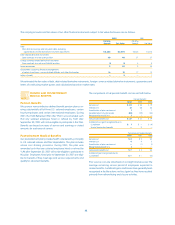
Additionally, as of the date of acquisition we recorded
approximately $49 million of reserves (“exit liabilities”) related to
our plans to consolidate certain support functions, and exit certain
markets through store refranchisings and closures, as presented
in the table below. The consolidation of certain support functions
included the termination of approximately 100 employees. Plans
associated with exiting certain markets through store refranchis-
ings and closures are expected to be finalized prior to May 7,
2003. Adjustments to the purchase price allocation related to the
finalization of these plans are not expected to be material. The
unpaid exit liabilities as of December 28, 2002 have been
reflected on our Consolidated Balance Sheet as accounts payable
and other current liabilities ($30 million) and other liabilities and
deferred credits ($10 million). Amounts recorded as other liabili-
ties and deferred credits are expected to result in payments
principally in 2004.
Lease and
Other
Contract
Severance Termi- Other
Benefits nations Costs Total
Total reserve as of
May 7, 2002 $ 13 $ 31 $ 5 $ 49
Amounts utilized in 2002 (8)
—
(1) (9)
Total reserve as of
December 28, 2002 $ 5 $ 31 $ 4 $ 40
Additionally, we expensed approximately $6 million of integration
costs related to the acquisition in 2002. These costs were recorded
as unusual items expense. See Note 7 for further discussion
regarding unusual items (income) expense.
The results of operations for YGR have been included in our
Consolidated Financial Statements since the date of acquisition. If
the acquisition had been completed as of the beginning of the
years ended December 28, 2002 and December 29, 2001, pro
forma Company sales, and franchise and license fees would have
been as follows:
2002 2001
Company sales $ 7,139 $ 6,683
Franchise and license fees 877 839
The impact of the acquisition, including interest expense on debt
incurred to finance the acquisition, on net income and diluted earn-
ings per share would not have been significant in 2002 and 2001.
The pro forma information is not necessarily indicative of the
results of operations had the acquisition actually occurred at the
beginning of each of these periods nor is it necessarily indicative
of future results.
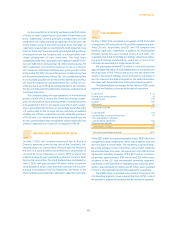
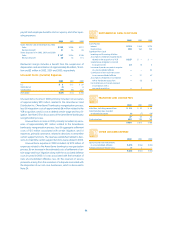
ACCUMULATED OTHER
COMPREHENSIVE INCOME (LOSS)
Accumulated other comprehensive income (loss), net of tax,
includes:
2002 2001
Foreign currency translation adjustment $ (176) $ (182)
Minimum pension liability adjustment (71) (24)
Unrealized losses on derivative instruments (2) (1)
Total accumulated other comprehensive
income (loss) $ (249) $ (207)
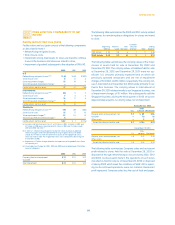
EARNINGS PER COMMON SHARE (“EPS”)
2002 2001 2000
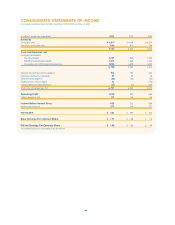
Net income $583 $ 492 $ 413
Basic EPS:
Weighted-average
common shares outstanding 296 293 294
Basic EPS $1.97 $ 1.68 $ 1.41
Diluted EPS:
Weighted-average
common shares outstanding 296 293 294
Shares assumed issued on exercise
of dilutive share equivalents 56 55 37
Shares assumed purchased with
proceeds of dilutive share equivalents (42) (44) (33)
Shares applicable to diluted earnings 310 304 298
Diluted EPS $ 1.88 $ 1.62 $ 1.39
Unexercised employee stock options to purchase approximately
1.4 million, 5.1 million and 21.7 million shares of our Common Stock
for the years ended December 28, 2002, December 29, 2001
and December 30, 2000, respectively, were not included in the
computation of diluted EPS because their exercise prices were
greater than the average market price of our Common Stock dur-
ing the year.
NOTE
6
NOTE
5
54.