Pizza Hut 2002 Annual Report Download - page 11
Download and view the complete annual report
Please find page 11 of the 2002 Pizza Hut annual report below. You can navigate through the pages in the report by either clicking on the pages listed below, or by using the keyword search tool below to find specific information within the annual report.-
 1
1 -
 2
2 -
 3
3 -
 4
4 -
 5
5 -
 6
6 -
 7
7 -
 8
8 -
 9
9 -
 10
10 -
 11
11 -
 12
12 -
 13
13 -
 14
14 -
 15
15 -
 16
16 -
 17
17 -
 18
18 -
 19
19 -
 20
20 -
 21
21 -
 22
22 -
23
-
24
-
25
-
26
-
27
-
28
-
29
-
30
-
31
-
32
-
33
-
34
-
35
-
36
-
37
-
38
-
39
-
40
-
41
-
42
-
43
-
44
-
45
-
46
-
47
-
48
-
49
-
50
-
51
-
52
-
53
-
54
-
55
-
56
-
57
-
58
-
59
-
60
-
61
-
62
-
63
-
64
-
65
-
66
-
67
-
68
-
69
-
70
-
71
-
72
-
73
-
74
-
75
-
76
-
77
-
78
-
79
-
80
 |
 |

9.
We clearly set the table for the next five years and our goals are bold:
•be the premier global restaurant company,
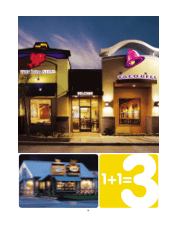
•transform the QSR industry with multibranding,
•become the best QSR operator in the world, and last but not least,
•be the best restaurant company investment.
Given our unique international, multibranding and operational growth opportunities, we intend to continue to grow
our earnings per share at least 10% every year. If we can deliver even better results, like we did in 2002, we will.
Our challenge going forward is simple: Execute and get better and better and better at what we do.
As a shareholder, I want you to know the five key measures we’re focused on to gauge our performance:
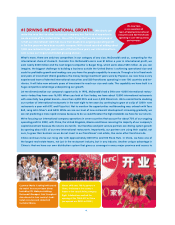
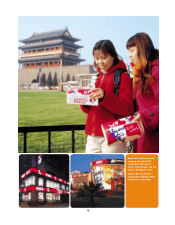
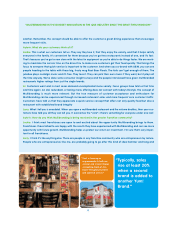
HOW YOU SHOULD MEASURE US 1) International Expansion…we want to add at least 1,000
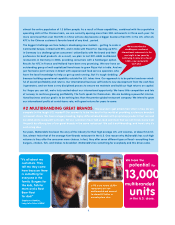
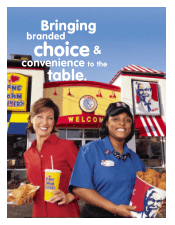
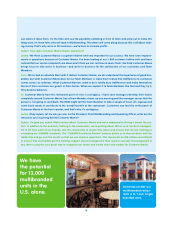
new units and grow earnings at least 15% each year. 2) Multibranding…we want to add at least 400 units per year
in the U.S. and grow that number every year. 3) U.S. Blended Same Store Sales Growth…we want to grow our same
store sales at least 2% per year. Looking at our core U.S. business on a blended basis reflects the advantage of
owning a portfolio of category-leading brands, diversified within the quick-service industry. The blended measure
is unique in our industry and so are we. The portfolio allows us to hedge the inevitable ups and downs at each of
our brands, and combined with multibranding, increases our capability to deliver at least a 2% blended same store
sales growth rate in 2003 and beyond. 4) Franchise Fees…we generate over $860 million in franchise fees with
minimal capital investment. We expect to grow fees 4–6% each year. 5) Return on Invested Capital…at 18%, we are
leading the quick-service restaurant industry. We expect to maintain our high returns by continuing to drive 16%
margins in stores we own and by meeting or exceeding our high standards for returns on new capital investments.
This will enable us to continue to generate substantial cash flow each year.
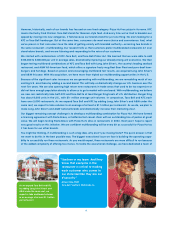
UNMATCHED TALENT I’m confident we will execute our unique strategies because of the outstand-
ing people we have in our company and our tremendous franchisees. We have a team that loves the restaurant
business and is passionate about achieving greatness. I am privileged to be working with the best talent in the
restaurant industry. Together, we are creating a customer mania and recognition culture that is allowing us to retain
and recruit the very best. We believe in our formula for success: people capability first, satisfied customers will fol-
low and then Yum! will make more money, and be an even greater investment for you.
I’d like to thank our dedicated team members, restaurant general managers, franchise partners, and outstanding
Board of Directors for their many contributions and commitment to customer mania. I’d particularly like to thank
Jeanette Wagner, who retired from our board this year, for her positive energy and support.
The table is set and the opportunities are ours for the taking…I hope you agree we are anything but your ordinary
restaurant company.
YUM! TO YOU!
David C. Novak
Chairman and Chief Executive Officer