Pizza Hut 2002 Annual Report Download - page 40
Download and view the complete annual report
Please find page 40 of the 2002 Pizza Hut annual report below. You can navigate through the pages in the report by either clicking on the pages listed below, or by using the keyword search tool below to find specific information within the annual report.-
 1
1 -
2
-
3
-
4
-
5
-
6
-
7
-
8
-
9
-
10
-
11
-
12
-
13
-
14
-
15
-
16
-
17
-
18
-
19
-
20
-
21
-
22
-
23
-
24
-
25
-
26
-
27
-
28
-
29
-
 30
30 -
 31
31 -
 32
32 -
 33
33 -
 34
34 -
 35
35 -
 36
36 -
 37
37 -
 38
38 -
 39
39 -
 40
40 -
 41
41 -
 42
42 -
 43
43 -
 44
44 -
 45
45 -
 46
46 -
 47
47 -
 48
48 -
 49
49 -
 50
50 -
51
-
52
-
53
-
54
-
55
-
56
-
57
-
58
-
59
-
60
-
61
-
62
-
63
-
64
-
65
-
66
-
67
-
68
-
69
-
70
-
71
-
72
-
73
-
74
-
75
-
76
-
77
-
78
-
79
-
80
 |
 |

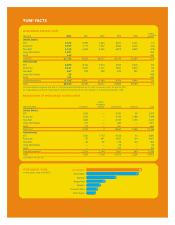
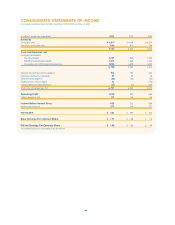
U.S. COMPANY RESTAURANT MARGIN
2002 2001 2000
Company sales 100.0% 100.0% 100.0%
Food and paper 28.2 28.6 28.6
Payroll and employee benefits 30.9 30.6 30.8
Occupancy and other operating expenses 24.9 25.6 25.4
Company restaurant margin 16.0% 15.2% 15.2%
Restaurant margin as a percentage of sales increased approxi-
mately 80 basis points in 2002. The increase includes the
favorable impact of approximately 50 basis points from the adop-
tion of SFAS 142, which was partially offset by the unfavorable
impact of approximately 20 basis points from the YGR acquisition.
The increase was primarily driven by the favorable impact of same
store sales growth on margin and lower food and paper costs,
partially offset by an increase in labor costs. The decrease in food
and paper costs was primarily driven by cheese costs. The
increase in labor costs was primarily driven by wage rates.
Restaurant margin as a percentage of sales was flat in 2001.
The favorable impact of same store sales growth on margin was
offset by increases in occupancy and other costs, food and paper
costs and labor costs. The increase in food and paper costs was
primarily driven by cheese costs. The increase in labor costs was
primarily driven by wage rates.
U.S. ONGOING OPERATING PROFIT
Ongoing operating profit increased $103 million or 14% in 2002,
including a 3% favorable impact from the adoption of SFAS 142.
Excluding the favorable impact of both SFAS 142 and the YGR
acquisition, ongoing operating profit increased 8%. The increase
was driven by same store sales growth and the favorable impact
of lapping franchise support costs related to the restructuring of
certain Taco Bell franchisees in 2001. The increase was partially
offset by higher restaurant operating costs, primarily due to higher
labor costs, and the unfavorable impact of refranchising and store
closures. The higher labor costs were driven by wage rates.
Ongoing operating profit decreased $20 million or 3% in 2001.
Excluding the unfavorable impact of lapping the fifty-third week
in 2000, ongoing operating profit decreased 1%. The decrease
was driven by the unfavorable impact of refranchising and store
closures, higher restaurant operating costs and higher franchise
support costs related to the restructuring of certain Taco Bell fran-
chisees. The decrease was partially offset by same store sales
growth and new unit development.
INTERNATIONAL RESULTS OF OPERATIONS
% B(W) % B(W)
2002 vs. 2001 2001 vs. 2000
Revenues
Company sales $ 2,113 14 $ 1,851 5
Franchise and license fees 297 8 275 6
Total revenues $ 2,410 13 $ 2,126 5
Company restaurant margin $ 337 31 $ 257 (4)
% of Company sales 16.0% 2.1ppts. 13.9% (1.2)ppts.
Ongoing operating profit $ 389 22 $ 318 3
38.
INTERNATIONAL RESTAURANT UNIT ACTIVITY
Unconsolidated
Company Affiliates Franchisees Licensees Total
Balance at Dec. 30, 2000 1,821 1,844 6,425 290 10,380
New Builds 338 150 553 8 1,049
Acquisitions 225 (28) (195) (2)
—
Refranchising (78) (20) 98
——
Closures (88) (39) (325) (50) (502)
Other(a) (67) 93 (26)
——
Balance at Dec. 29, 2001 2,151 2,000 6,530 246 10,927
New Builds 375 161 515 10 1,061
Acquisitions(b) 6 41 163
—
210
Refranchising (127) (14) 141
——
Closures (71) (46) (298) (27) (442)
Other(c) (1) 2103142
Balance at Dec. 28, 2002 2,333 2,144 7,061 260 11,798
% of Total 20% 18% 60% 2% 100%
(a) Primarily includes 52 Company stores and 41 franchisee stores contributed to an unconsolidated affiliate in 2001.
(b) Includes units that existed at the date of the acquisition of YGR on May 7, 2002.
(c) Primarily represents licensee units transferred from U.S. to International in 2002.