Pizza Hut 2002 Annual Report Download - page 57
Download and view the complete annual report
Please find page 57 of the 2002 Pizza Hut annual report below. You can navigate through the pages in the report by either clicking on the pages listed below, or by using the keyword search tool below to find specific information within the annual report.-
 1
1 -
2
-
3
-
4
-
5
-
6
-
7
-
8
-
9
-
10
-
11
-
12
-
13
-
14
-
15
-
16
-
17
-
18
-
19
-
20
-
21
-
22
-
23
-
24
-
25
-
26
-
27
-
28
-
29
-
30
-
31
-
32
-
33
-
34
-
35
-
36
-
37
-
38
-
39
-
40
-
41
-
42
-
43
-
44
-
45
-
46
-
 47
47 -
 48
48 -
 49
49 -
 50
50 -
 51
51 -
 52
52 -
 53
53 -
 54
54 -
 55
55 -
 56
56 -
 57
57 -
 58
58 -
 59
59 -
 60
60 -
 61
61 -
 62
62 -
 63
63 -
 64
64 -
 65
65 -
 66
66 -
 67
67 -
68
-
69
-
70
-
71
-
72
-
73
-
74
-
75
-
76
-
77
-
78
-
79
-
80
 |
 |

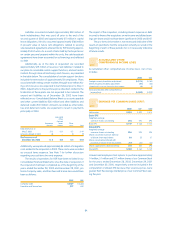
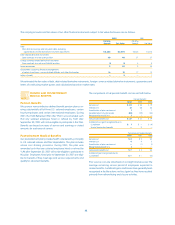
ITEMS AFFECTING COMPARABILITY OF NET
INCOME
Facility Actions Net Loss (Gain)
Facility actions net loss (gain) consists of the following components
as described in Note 2:
•Refranchising net (gains) losses;
•Store closure costs;
•Impairment of long-lived assets for stores we intend to continue
to use in the business and stores we intend to close;
•Impairment of goodwill subsequent to the adoption of SFAS 142.
2002 2001 2000
U.S.
Refranchising net (gains) losses(a) (b) $ (4) $ (44) $ (202)
Store closure costs 813 6
Store impairment charges 15 14 8
SFAS 142 goodwill impairment charges
———
Facility actions net loss (gain) 19 (17) (188)
International
Refranchising net (gains) losses(a) (b) (15) 52
Store closure costs 744
Store impairment charges 16 96
SFAS 142 goodwill impairment charges(c) 5
——
Facility actions net loss (gain) 13 18 12
Worldwide
Refranchising net (gains) losses(a) (b) (19) (39) (200)
Store closure costs 15 17 10
Store impairment charges(d) 31 23 14
SFAS 142 goodwill impairment charges(c) 5
——
Facility actions net loss (gain) $32 $ 1 $ (176)
(a) Includes initial franchise fees in the U.S. of $1 million in 2002, $4 million in 2001, and
$17 million in 2000 and in International of $5 million in 2002 and $3 million in both
2001 and 2000. See Note 9.
(b) In 2001, U.S. refranchising net (gains) included $12 million of previously deferred
refranchising gains and International refranchising net (gains) losses included a
charge of $11 million to mark to market the net assets of the Singapore business,
which was held for sale. The Singapore business was subsequently sold during the
third quarter of 2002.
(c) Represents a $5 million charge related to the impairment of the goodwill of our Pizza
Hut reporting unit.
(d) Store impairment charges for 2002, 2001 and 2000 were recorded against the follow-
ing asset categories:
2002 2001 2000
Property, plant and equipment $31 $23 $12
Goodwill
——
2
Total impairment $31 $23 $14
NOTE 7
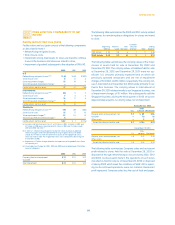
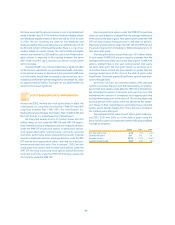
55.
Yum! Brands Inc.
The following table summarizes the 2002 and 2001 activity related
to reserves for remaining lease obligations for stores we intend
to close:
Estimate/
Beginning Amounts New Decision Ending
Balance Used Decisions Changes Other Balance
2001 Activity $ 50 (18) 6 1 9 $ 48
2002 Activity $ 48 (17) 16 3 1 $ 51
The following table summarizes the carrying values of the major
classes of assets held for sale at December 28, 2002 and
December 29, 2001. The carrying values of liabilities held for sale
at December 28, 2002 and December 29, 2001 were not sig-
nificant. U.S. amounts primarily represent land on which we
previously operated restaurants and are net of impairment
charges of $4 million and $5 million, respectively. The carrying val-
ues in International at December 28, 2002 relate primarily to our
Puerto Rico business. The carrying values in International at
December 29, 2001 relate primarily to our Singapore business, net
of impairment charges of $11 million. We subsequently sold the
Singapore business during the third quarter of 2002 at a price
approximately equal to its carrying value, net of impairment.
December 28, 2002
Inter-
U.S. national Worldwide
Property, plant and equipment, net $7 $ 89 $96
Goodwill
—
13 13
Other assets
—
22
Assets classified as held for sale $ 7 $ 104 $ 111
December 29, 2001
Inter-
U.S. national Worldwide
Property, plant and equipment, net $ 8 $ 32 $ 40
Other assets
—
44
Assets classified as held for sale $ 8 $ 36 $ 44
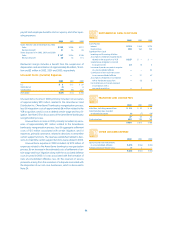
The following table summarizes Company sales and restaurant
profit related to stores held for sale at December 28, 2002 or
disposed of through refranchising or closure during 2002, 2001
and 2000. As discussed in Note 2, the operations of such stores
classified as held for sale as of December 28, 2002 or disposed
of during 2002 which meet the conditions of SFAS 144 for report-
ing as discontinued operations were not material. Restaurant
profit represents Company sales less the cost of food and paper,