Pizza Hut 2002 Annual Report Download - page 37
Download and view the complete annual report
Please find page 37 of the 2002 Pizza Hut annual report below. You can navigate through the pages in the report by either clicking on the pages listed below, or by using the keyword search tool below to find specific information within the annual report.-
 1
1 -
2
-
3
-
4
-
5
-
6
-
7
-
8
-
9
-
10
-
11
-
12
-
13
-
14
-
15
-
16
-
17
-
18
-
19
-
20
-
21
-
22
-
23
-
24
-
25
-
26
-
 27
27 -
 28
28 -
 29
29 -
 30
30 -
 31
31 -
 32
32 -
 33
33 -
 34
34 -
 35
35 -
 36
36 -
 37
37 -
 38
38 -
 39
39 -
 40
40 -
 41
41 -
 42
42 -
 43
43 -
 44
44 -
 45
45 -
 46
46 -
 47
47 -
48
-
49
-
50
-
51
-
52
-
53
-
54
-
55
-
56
-
57
-
58
-
59
-
60
-
61
-
62
-
63
-
64
-
65
-
66
-
67
-
68
-
69
-
70
-
71
-
72
-
73
-
74
-
75
-
76
-
77
-
78
-
79
-
80
 |
 |

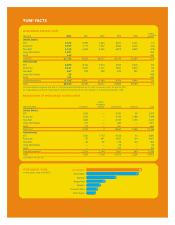
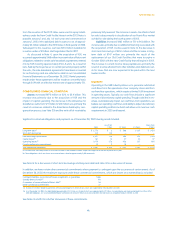
WORLDWIDE COMPANY RESTAURANT MARGIN
2002 2001 2000
Company sales 100.0% 100.0% 100.0%
Food and paper 30.6 31.1 30.8
Payroll and employee benefits 27.2 27.1 27.7
Occupancy and other operating expenses 26.2 27.0 26.4
Company restaurant margin 16.0% 14.8% 15.1%
Restaurant margin as a percentage of sales increased approxi-
mately 120 basis points in 2002. The increase included the
favorable impact of approximately 50 basis points from the adop-
tion of SFAS 142, partially offset by the unfavorable impact of
approximately 15 basis points from the YGR acquisition. U.S.
restaurant margin increased approximately 80 basis points and
International restaurant margin increased approximately 210
basis points.
Restaurant margin as a percentage of sales decreased
approximately 30 basis points in 2001. U.S. restaurant margin was
flat and International restaurant margin declined approximately
120 basis points.
WORLDWIDE GENERAL AND ADMINISTRATIVE
EXPENSES
G&A expenses increased $117 million or 15% in 2002. Excluding the
unfavorable impact of the YGR acquisition, G&A expenses increased
10%. The increase was primarily driven by higher compensation-
related costs and higher corporate and project spending.
G&A expenses decreased $34 million or 4% in 2001. Exclud-
ing the favorable impact of lapping the fifty-third week in 2000,
G&A expenses decreased 3%. The decrease was driven by lower
corporate and project spending, the formation of unconsolidated
affiliates and refranchising. The decrease was partially offset by
higher compensation-related costs.
WORLDWIDE FRANCHISE AND LICENSE EXPENSES
Franchise and license expenses decreased $10 million or 18% in
2002. The decrease was primarily attributable to lower allowances
for doubtful franchise and license fee receivables and the favor-
able impact of lapping support costs related to the financial
restructuring of certain Taco Bell franchisees in 2001. The decrease
was partially offset by higher marketing support costs in certain
international markets.
Franchise and license expenses increased $10 million or 20%
in 2001. The increase was primarily due to support costs related
to the financial restructuring of certain Taco Bell franchisees. The
increase was partially offset by lower allowances for doubtful fran-
chise and license fee receivables.
35.
Yum! Brands Inc.
WORLDWIDE OTHER (INCOME) EXPENSE
Other (income) expense is comprised of equity (income) loss from
investments in unconsolidated affiliates and foreign exchange net
(gain) loss.
Other (income) expense increased $7 million or 28% in 2002.
Equity income increased $3 million or 12%. The impact from for-
eign currency translation was not significant on equity income. The
increase included a $4 million favorable impact from the adoption
of SFAS 142.
Other (income) expense decreased $2 million or 8% in 2001.
Equity income increased $1 million or 3%, after a 6% unfavorable
impact from foreign currency translation.
WORLDWIDE FACILITY ACTIONS NET LOSS (GAIN)
We recorded facility actions net loss of $32 million in 2002 and
$1 million in 2001 and facility actions net gain of $176 million in
2000. See the Store Portfolio Strategy section for more detail of our
refranchising and closure activities and Note 7 for a summary of
the components of facility actions net loss (gain) by reportable
operating segment.
WORLDWIDE ONGOING OPERATING PROFIT
% B(W) % B(W)
2002 vs. 2001 2001 vs. 2000
United States $ 825 14 $ 722 (3)
International 389 22 318 3
Unallocated and
corporate expenses (178) (20) (148) 9
Unallocated other
income (expense) (1) 59 (3) NM
Ongoing operating profit $ 1,035 16 $ 889
—
The changes in U.S. and International ongoing operating profit for
2002 and 2001 are discussed in the respective sections.
Unallocated and corporate expenses increased $30 million
or 20% in 2002. The increase was primarily driven by higher com-
pensation-related costs and higher corporate and project spending.
Unallocated and corporate expenses decreased $15 million
or 9% in 2001. Excluding the favorable impact of lapping the fifty-
third week in 2000, G&A decreased 8%. The decline was primarily
due to lower corporate and project spending partially offset by
higher compensation-related costs.