Pizza Hut 2002 Annual Report Download - page 67
Download and view the complete annual report
Please find page 67 of the 2002 Pizza Hut annual report below. You can navigate through the pages in the report by either clicking on the pages listed below, or by using the keyword search tool below to find specific information within the annual report.-
 1
1 -
2
-
3
-
4
-
5
-
6
-
7
-
8
-
9
-
10
-
11
-
12
-
13
-
14
-
15
-
16
-
17
-
18
-
19
-
20
-
21
-
22
-
23
-
24
-
25
-
26
-
27
-
28
-
29
-
30
-
31
-
32
-
33
-
34
-
35
-
36
-
37
-
38
-
39
-
40
-
41
-
42
-
43
-
44
-
45
-
46
-
47
-
48
-
49
-
50
-
51
-
52
-
53
-
54
-
55
-
56
-
 57
57 -
 58
58 -
 59
59 -
 60
60 -
 61
61 -
 62
62 -
 63
63 -
 64
64 -
 65
65 -
 66
66 -
 67
67 -
 68
68 -
 69
69 -
 70
70 -
 71
71 -
 72
72 -
 73
73 -
 74
74 -
 75
75 -
 76
76 -
 77
77 -
78
-
79
-
80
 |
 |

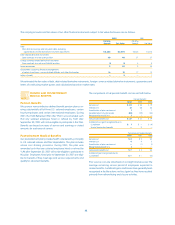
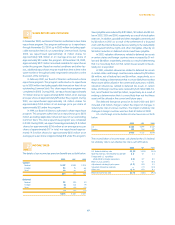
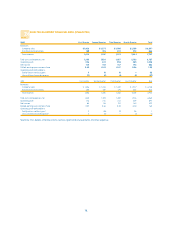
A summary of the status of all options granted to employees and non-employee directors as of December 28, 2002, December 29, 2001
and December 30, 2000, and changes during the years then ended is presented below (tabular options in thousands):
December 28, 2002 December 29, 2001 December 30, 2000
Wtd. Avg. Wtd. Avg. Wtd. Avg.
Options Exercise Price Options Exercise Price Options Exercise Price
Outstanding at beginning of year 54,4 52 $ 16.04 53,358 $ 15.60 48,331 $ 15.59
Granted at price equal to average market price 6,974 25.52 10,019 17.34 15,719 15.1 7
Exercised (8,876) 14.06 (3,635) 11.56 (3,657) 10.92
Forfeited (2,920) 19.07 (5,290) 17.1 6 (7,035) 16.99
Outstanding at end of year 49,630 $ 17.54 54,452 $ 16.04 53,358 $ 15.60
Exercisable at end of year 17,762 $ 13.74 12,962 $ 12.76 15,244 $ 12.30
Weighted average fair value of options
granted during the year $ 10.44 $ 7.10 $ 6.74
The following table summarizes information about stock options outstanding and exercisable at December 28, 2002 (tabular options in
thousands):
Options Outstanding Options Exercisable
Range of Wtd. Avg. Remaining Wtd. Avg. Wtd. Avg.
Exercise Prices Options Contractual Life Exercise Price Options Exercise Price
$ 0 – 10 1,402 1.92 $ 7.60 1,402 $ 7.60
10 – 15 10,416 4.27 12.77 9,888 12.75
15 – 20 24,696 7.01 16. 1 7 6,13 6 16.24
20 – 30 12,412 7.75 24.35 325 22.46
30 – 40 704 6.30 36.32 11 36.38
49,630 17,762
65.
Yum! Brands Inc.
In November 1997, we granted two awards of performance
restricted stock units of YUM’s Common Stock to our Chief Executive
Officer (“CEO”). The awards were made under the 1997 LTIP and
may be paid in Common Stock or cash at the discretion of the
Compensation Committee of the Board of Directors. Payment of
an award of $2.7 million was contingent upon the CEO’s contin-
ued employment through January 25, 2001 and our attainment of
certain pre-established earnings thresholds. In January 2001, our
CEO received a cash payment of $2.7 million following the
Compensation Committee’s certification of YUM’s attainment of the
pre-established earnings threshold. Payment of an award of $3.6
million is contingent upon his employment through January 25,
2006 and our attainment of certain pre-established earnings
thresholds. The annual expense related to these awards included
in earnings was $0.4 million for 2002, $0.5 million for 2001 and
$1.3 million for 2000.
OTHER COMPENSATION AND BENEFIT
PROGRAMS
We sponsor two deferred compensation benefit programs, the
Restaurant Deferred Compensation Plan and the Executive
Income Deferral Program (the “RDC Plan” and the “EID Plan,”
respectively) for eligible employees and non-employee directors.
Effective October 1, 2001, participants can no longer defer
funds into the RDC Plan. Prior to that date, the RDC Plan allowed
participants to defer a portion of their annual salary. The partici-
pant’s balances will remain in the RDC Plan until their scheduled
distribution dates. As defined by the RDC Plan, we credit the
amounts deferred with earnings based on the investment options
selected by the participants. Investment options in the RDC Plan
consist of phantom shares of various mutual funds and YUM
Common Stock. We recognize compensation expense for the
appreciation or depreciation, if any, attributable to all investments
in the RDC Plan, and prior to October 1, 2001, for any matching
contributions. Our obligations under the RDC program as of the
end of 2002 and 2001 were $10 million and $13 million, respec-
tively. We recognized annual compensation expense of less than
$1 million in 2002, $3 million in 2001 and $1 million in 2000 for the
RDC Plan.
NOTE
19