Pizza Hut 2001 Annual Report Download - page 68
Download and view the complete annual report
Please find page 68 of the 2001 Pizza Hut annual report below. You can navigate through the pages in the report by either clicking on the pages listed below, or by using the keyword search tool below to find specific information within the annual report.-
 1
1 -
2
-
3
-
4
-
5
-
6
-
7
-
8
-
9
-
10
-
11
-
12
-
13
-
14
-
15
-
16
-
17
-
18
-
19
-
20
-
21
-
22
-
23
-
24
-
25
-
26
-
27
-
28
-
29
-
30
-
31
-
32
-
33
-
34
-
35
-
36
-
37
-
38
-
39
-
40
-
41
-
42
-
43
-
44
-
45
-
46
-
47
-
48
-
49
-
50
-
51
-
52
-
53
-
54
-
55
-
56
-
57
-
 58
58 -
 59
59 -
 60
60 -
 61
61 -
 62
62 -
 63
63 -
 64
64 -
 65
65 -
 66
66 -
 67
67 -
 68
68 -
 69
69 -
 70
70 -
 71
71 -
 72
72
 |
 |

66 TRICON GLOBAL RESTAURANTS, INC. AND SUBSIDIARIES
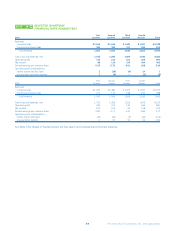
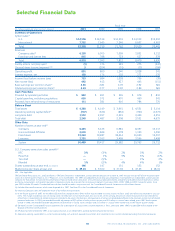
Selected Financial Data
Fiscal Year
(in millions, except per share and unit amounts) 2001 2000 1999 1998 1997
Summary of Operations
System sales(a)
U.S. $ 14,596 $ 14,514 $ 14,516 $ 14,013 $13,502
International 7,732 7,645 7,246 6,607 6,963
Total 22,328 22,159 21,762 20,620 20,465
Revenues
Company sales(b) 6,138 6,305 7,099 7,852 9,112
Franchise and license fees 815 788 723 627 578
Total 6,953 7,093 7,822 8,479 9,690
Facility actions net (loss) gain(c) (1) 176 381 275 (247)
Unusual items income (expense)(c)(d) 3(204) (51) (15) (184)
Operating profit 891 860 1,240 1,028 241
Interest expense, net 158 176 202 272 276
Income (loss) before income taxes 733 684 1,038 756 (35)
Net income (loss) 492 413 627 445 (111)
Basic earnings per common share(e) 3.36 2.81 4.09 2.92 N/A
Diluted earnings per common share(e) 3.24 2.77 3.92 2.84 N/A
Cash Flow Data
Provided by operating activities $ 832 $ 491 $ 565 $ 674 $ 810
Capital spending, excluding acquisitions 636 572 470 460 541
Proceeds from refranchising of restaurants 111 381 916 784 770
Balance Sheet
Total assets $ 4,388 $ 4,149 $ 3,961 $ 4,531 $ 5,114
Operating working capital deficit(f) (707) (634) (832) (960) (1,073)
Long-term debt 1,552 2,397 2,391 3,436 4,551
Total debt 2,248 2,487 2,508 3,532 4,675
Other Data
Number of stores at year end(a)
Company 6,435 6,123 6,981 8,397 10,117
Unconsolidated Affiliates 2,000 1,844 1,178 1,120 1,090
Franchisees 19,263 19,287 18,414 16,650 15,097
Licensees 2,791 3,163 3,409 3,596 3,408
System 30,489 30,417 29,982 29,763 29,712
U.S. Company same store sales growth(a)
KFC 3% (3)% 2% 3% 2%
Pizza Hut —1% 9% 6% (1)%
Taco Bell —(5)% — 3% 2%
Blended 1% (2)% 4% 4% 1%
Shares outstanding at year end (in millions) 146 147 151 153 152
Market price per share at year end $ 49.24 $ 33.00 $ 37.94 $ 47.63 $ 28.31
N/A – Not Applicable.
TRICON Global Restaurants, Inc. and Subsidiaries (“TRICON”) became an independent, publicly owned company on October 6, 1997 through the spin-off of the restaurant oper-
ations of its former parent, PepsiCo, Inc. (“PepsiCo”), to its shareholders. The 1997 consolidated financial data was prepared as if we had been an independent, publicly owned
company for that period. To facilitate this presentation, PepsiCo made certain allocations of its previously unallocated interest and general and administrative expenses as well as
pro forma computations, to the extent possible, of separate income tax provisions for its restaurant segment. Fiscal years 2001, 1999, 1998 and 1997 include 52 weeks. Fiscal
year 2000 includes 53 weeks. The selected financial data should be read in conjunction with the Consolidated Financial Statements and the Notes thereto.
(a) Excludes Non-core Businesses, which were disposed of in 1997. See Note 22 to the Consolidated Financial Statements.
(b) Declining Company sales are largely the result of our refranchising initiatives.
(c) In the fourth quarter of 1997, we recorded a $530 million charge of which $410 million was recorded in facility actions net (loss) and $120 million was recorded in unusual
items. The charge included (a) costs of closing stores; (b) reductions to fair market value, less cost to sell, of the carrying amounts of certain restaurants that we intended to
refranchise; (c) impairments of certain restaurants intended to be used in the business; (d) impairments of certain unconsolidated affiliates to be retained; and (e) costs of related
personnel reductions. In 1999, we recorded favorable adjustments of $13 million in facility actions net gain and $11 million in unusual items related to our 1997 fourth quarter
charge. In 1998, we recorded favorable adjustments of $54 million in facility actions net gain and $11 million in unusual items related to our 1997 fourth quarter charge.
(d) See Note 5 to the Consolidated Financial Statements for a description of unusual items income (expense) in 2001, 2000 and 1999. 1997 included $54 million related to the
disposal of the Non-core Businesses.
(e) EPS data has been omitted for 1997 as our capital structure as an independent, publicly owned company did not exist.
(f) Operating working capital deficit is current assets excluding cash and cash equivalents and short-term investments, less current liabilities excluding short-term borrowings.