Pizza Hut 2001 Annual Report Download - page 49
Download and view the complete annual report
Please find page 49 of the 2001 Pizza Hut annual report below. You can navigate through the pages in the report by either clicking on the pages listed below, or by using the keyword search tool below to find specific information within the annual report.
ITEMS AFFECTING COMPARABILITY
OF NET INCOME
Facility Actions Net Loss (Gain)
Facility actions net loss (gain) consists of the following three
components as described in Note 2:
• Refranchising (gains) losses;
• Store closure costs; and
• Impairment of long-lived assets for restaurants we intend to con-
tinue to use in the business and restaurants we intend to close.
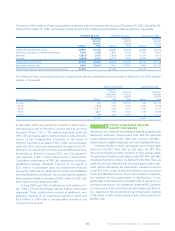
2001 2000 1999(a)
U.S.
Refranchising net (gains)(b)(c) $ (44) $ (202) $ (405)
Store closure costs 13 65
Impairment charges for stores that
will continue to be used in the business 10 36
Impairment charges for stores to be closed 459
Facility actions net (gain) (17) (188) (385)
International
Refranchising net losses (gains)(b)(c) 52 (17)
Store closure costs 448
Impairment charges for stores that
will continue to be used in the business 8510
Impairment charges for stores to be closed 113
Facility actions net loss 18 12 4
Worldwide
Refranchising net (gains)(b)(c) (39) (200) (422)
Store closure costs 17 10 13
Impairment charges for stores that
will continue to be used in the business(d) 18 816
Impairment charges for stores to be closed(d) 5612
Facility actions net loss (gain) $1 $ (176) $ (381)
(a) Includes favorable adjustments of $19 million in the U.S. and unfavorable adjust-
ments of $6 million in International related to our 1997 fourth quarter charge.
These adjustments primarily related to lower-than-expected losses from stores dis-
posed of, decisions to retain certain stores originally expected to be disposed of
and changes in estimated costs. The original fourth quarter 1997 charge included
estimates for the costs of closing stores; reductions to fair market value, less costs
to sell, of the carrying amounts of certain restaurants we intended to refranchise;
and impairments of certain restaurants intended to be used in the business.
(b) Includes initial franchise fees in the U.S. of $4 million in 2001, $17 million in 2000
and $38 million in 1999 and in International of $3 million in both 2001 and 2000
and $7 million in 1999. See Note 7.
(c) In 2001, U.S. refranchising net (gains) included $12 million of previously deferred
refranchising gains and International refranchising net losses (gains) included a
charge of $11 million to mark to market the net assets of the Singapore business,
which is held for sale.
(d) Impairment charges for 2001, 2000 and 1999 were recorded against the following
asset categories:
2001 2000 1999
Property, plant and equipment $23 $12 $25
Goodwill ——1
Reacquired franchise rights —22
Total impairment $23 $14 $28
5
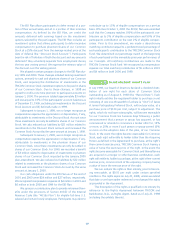
NOTE The following table summarizes the 2001 and 2000 activity
related to reserves for stores disposed of or held for disposal.
Asset
Impairment
Allowances Liabilities
Balance at December 25, 1999 $ 20 $ 71
Amounts used (10) (22)
(Income) expense impact:
New decisions 14 5
Estimate/decision changes (4) (7)
Other — 3
Balance at December 30, 2000 $ 20 $ 50
Amounts used (8) (18)
(Income) expense impact:
New decisions 21 6
Estimate/decision changes — 1
Other (6) 9
Balance at December 29, 2001 $ 27 $ 48
The following table summarizes the carrying value of assets held
for disposal by reportable operating segment.
2001 2000
U.S. $8 $6
International(a) 36 —
$44 $6
(a) The carrying value in 2001 related to the Singapore business, which operates
approximately 100 stores as of December 29, 2001.
The following table summarizes Company sales and restaurant
margin related to stores held for disposal at December 29, 2001
or disposed of through refranchising or closure during 2001,
2000 and 1999. Restaurant margin represents Company sales
less the cost of food and paper, payroll and employee benefits
and occupancy and other operating expenses. These amounts
do not include the impact of Company stores that have been
contributed to unconsolidated affiliates.
2001 2000 1999
Stores held for disposal at
December 29, 2001:
Sales $114 $ 114 $ 110
Restaurant margin 9812
Stores disposed of in 2001, 2000
and 1999:
Sales $157 $ 684 $1,716
Restaurant margin 15 88 202
Restaurant margin includes a benefit from the suspension of
depreciation and amortization of approximately $1 million,
$2 million and $9 million in 2001, 2000 and 1999, respectively.
47
5
NOTE


