Pizza Hut 2001 Annual Report Download - page 58
Download and view the complete annual report
Please find page 58 of the 2001 Pizza Hut annual report below. You can navigate through the pages in the report by either clicking on the pages listed below, or by using the keyword search tool below to find specific information within the annual report.-
 1
1 -
2
-
3
-
4
-
5
-
6
-
7
-
8
-
9
-
10
-
11
-
12
-
13
-
14
-
15
-
16
-
17
-
18
-
19
-
20
-
21
-
22
-
23
-
24
-
25
-
26
-
27
-
28
-
29
-
30
-
31
-
32
-
33
-
34
-
35
-
36
-
37
-
38
-
39
-
40
-
41
-
42
-
43
-
44
-
45
-
46
-
47
-
 48
48 -
 49
49 -
 50
50 -
 51
51 -
 52
52 -
 53
53 -
 54
54 -
 55
55 -
 56
56 -
 57
57 -
 58
58 -
 59
59 -
 60
60 -
 61
61 -
 62
62 -
 63
63 -
 64
64 -
 65
65 -
 66
66 -
 67
67 -
 68
68 -
69
-
70
-
71
-
72
 |
 |

56 TRICON GLOBAL RESTAURANTS, INC. AND SUBSIDIARIES
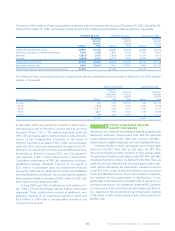
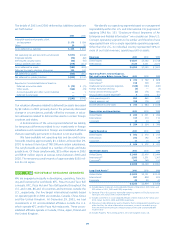
A summary of the status of all options granted to employees and non-employee directors as of December 29, 2001, December 30,
2000 and December 25, 1999, and changes during the years then ended is presented below (tabular options in thousands):
December 29, 2001 December 30, 2000 December 25, 1999
Weighted Weighted Weighted
Average Average Average
Exercise Exercise Exercise
Options Price Options Price Options Price
Outstanding at beginning of year 26,679 $ 31.20 24,166 $ 31.18 22,699 $ 26.16
Granted at price equal to average market price 5,009 34.68 7,860 30.33 5,709 49.07
Exercised (1,817) 23.12 (1,829) 21.84 (1,273) 19.51
Forfeited (2,645) 34.31 (3,518) 33.99 (2,969) 31.94
Outstanding at end of year 27,226 $ 32.07 26,679 $ 31.20 24,166 $ 31.18
Exercisable at end of year 6,481 $ 25.53 7,622 $ 24.59 3,665 $ 22.44
Weighted average fair value of options at date of grant $ 14.20 $13.48 $ 19.20
The following table summarizes information about stock options outstanding and exercisable at December 29, 2001 (tabular
options in thousands):
Options Outstanding Options Exercisable
Weighted
Average Weighted Weighted
Remaining Average Average
Contractual Exercise Exercise
Range of Exercise Prices Options Life Price Options Price
$ 0–20 934 2.91 $ 15.21 934 $ 15.21
20–30 7,846 5.32 25.82 3,674 24.34
30–35 13,211 7.89 31.70 1,676 31.77
35–55 4,842 7.69 43.18 192 42.83
55–75 393 7.26 72.75 5 72.75
27,226 6,481
In November 1997, we granted two awards of performance
restricted stock units of TRICON’s Common Stock to our Chief
Executive Officer (“CEO”). The awards were made under the
1997 LTIP and may be paid in Common Stock or cash at the dis-
cretion of the Compensation Committee of the Board of
Directors. Payment of an award of $2.7 million was contingent
upon the CEO’s continued employment through January 25,
2001 and our attainment of certain pre-established earnings
thresholds, as defined. In January 2001, our CEO received a
cash payment of $2.7 million following the Compensation
Committee’s certification of TRICON’s attainment of the pre-
established earnings threshold. Payment of an award of
$3.6 million is contingent upon his employment through
January 25, 2006 and our attainment of certain pre-established
earnings thresholds, as defined. The annual expense related to
these awards included in earnings was $0.5 million for 2001 and
$1.3 million for both 2000 and 1999.
During 2000 and 1999, modifications were made to cer-
tain 1997 LTIP and SharePower options held by terminated
employees. These modifications resulted in additional com-
pensation expense of an insignificant amount in 2000 and
$5.0 million in 1999 with a corresponding increase in our
Common Stock account.
OTHER COMPENSATION AND
BENEFIT PROGRAMS
We sponsor two deferred compensation benefit programs, the
Restaurant Deferred Compensation Plan and the Executive
Income Deferral Program (the “RDC Plan” and the “EID Plan,”
respectively) for eligible employees and non-employee directors.
Effective October 1, 2001, participants can no longer defer
funds into the RDC Plan. Prior to that date, the RDC Plan
allowed participants to defer a portion of their annual salary.
The participant’s balances will remain in the RDC Plan until their
scheduled distribution dates. As defined by the RDC Plan, we
credit the amounts deferred with earnings based on the invest-
ment options selected by the participants. Investment options
in the RDC Plan consist of phantom shares of various mutual
funds and TRICON Common Stock. We recognize compensa-
tion expense for the appreciation or depreciation, if any,
attributable to all investments in the RDC Plan as well as for our
matching contribution. Our obligations under the RDC program
as of the end of 2001 and 2000 were $13 million and $10 mil-
lion, respectively. We recognized annual compensation expense
of $3 million in 2001 and $1 million in both 2000 and 1999 for
the RDC Plan.
17
NOTE