Pizza Hut 2001 Annual Report Download - page 29
Download and view the complete annual report
Please find page 29 of the 2001 Pizza Hut annual report below. You can navigate through the pages in the report by either clicking on the pages listed below, or by using the keyword search tool below to find specific information within the annual report.-
 1
1 -
2
-
3
-
4
-
5
-
6
-
7
-
8
-
9
-
10
-
11
-
12
-
13
-
14
-
15
-
16
-
17
-
18
-
 19
19 -
 20
20 -
 21
21 -
 22
22 -
 23
23 -
 24
24 -
 25
25 -
 26
26 -
 27
27 -
 28
28 -
 29
29 -
 30
30 -
 31
31 -
 32
32 -
 33
33 -
 34
34 -
 35
35 -
 36
36 -
 37
37 -
 38
38 -
 39
39 -
40
-
41
-
42
-
43
-
44
-
45
-
46
-
47
-
48
-
49
-
50
-
51
-
52
-
53
-
54
-
55
-
56
-
57
-
58
-
59
-
60
-
61
-
62
-
63
-
64
-
65
-
66
-
67
-
68
-
69
-
70
-
71
-
72
 |
 |

27
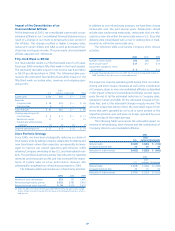
Impact of the Consolidation of an
Unconsolidated Affiliate
At the beginning of 2001, we consolidated a previously uncon-
solidated affiliate in our Consolidated Financial Statements as a
result of a change in our intent to temporarily retain control of
this affiliate. This change resulted in higher Company sales,
restaurant margin dollars and G&A as well as decreased fran-
chise fees and equity income. This previously unconsolidated
affiliate operates over 100 stores.
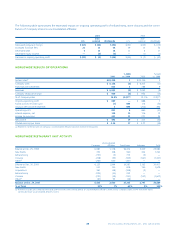
Fifty-third Week in 2000
Our fiscal calendar results in a fifty-third week every 5 or 6 years.
Fiscal year 2000 included a fifty-third week in the fourth quarter.
The estimated favorable impact in net income was $10 million
or $0.07 per diluted share in 2000. The following table sum-
marizes the estimated favorable/(unfavorable) impact of the
fifty-third week on system sales, revenues and ongoing oper-
ating profit:
Inter-
U.S. national Unallocated Total
System sales $230 $ 65 $ — $ 295
Revenues
Company sales $ 58 $ 18 $ — $ 76
Franchise fees 9 2 — 11
Total revenues $ 67 $ 20 $ — $ 87
Ongoing operating profit
Franchise fees $ 9 $ 2 $ — $ 11
Restaurant margin 11 4 — 15
General and administrative
expenses (3) (2) (2) (7)
Ongoing operating profit $ 17 $ 4 $ (2) $ 19
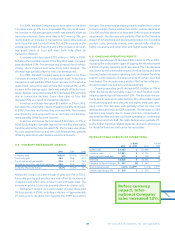
Store Portfolio Strategy
Since 1995, we have been strategically reducing our share of
total system units by selling Company restaurants to existing and
new franchisees where their expertise can generally be lever-
aged to improve our overall operating performance, while
retaining Company ownership of key U.S. and International mar-
kets. This portfolio-balancing activity has reduced our reported
revenues and restaurant profits and has increased the impor-
tance of system sales as a key performance measure. We
substantially completed our refranchising program in 2001.
The following table summarizes our refranchising activities:
2001 2000 1999
Number of units refranchised 233 757 1,435
Refranchising proceeds, pre-tax $ 111 $ 381 $ 916
Refranchising net gains, pre-tax(a) $39 $ 200 $ 422
(a) 2001 includes $12 million of previously deferred refranchising gains and a charge
of $11 million to mark to market the net assets of the Singapore business, which is
held for sale.
In addition to our refranchising program, we have been closing
restaurants over the past several years. Restaurants closed
include poor performing restaurants, restaurants that are relo-
cated to a new site within the same trade area or U.S. Pizza Hut
delivery units consolidated with a new or existing dine-in tradi-
tional store within the same trade area.
The following table summarizes Company store closure
activities:
2001 2000 1999
Number of units closed 270 208 301
Store closure costs(a) $17 $10 $13
Impairment charges for stores
to be closed $5 $6 $12
(a) Includes favorable adjustments to our 1997 fourth quarter charge of $9 million in
1999. See Note 5 for a discussion of these adjustments.
The impact on ongoing operating profit arising from our refran-
chising and store closure initiatives as well as the contribution
of Company stores to new unconsolidated affiliates as described
in the Impact of New Unconsolidated Affiliates section repre-
sents the net of (a) the estimated reduction in Company sales,
restaurant margin and G&A; (b) the estimated increase in fran-
chise fees; and (c) the estimated change in equity income. The
amounts presented below reflect the estimated impact from
stores that were operated by us for all or some portion of the
respective previous year and were no longer operated by us as
of the last day of the respective year.
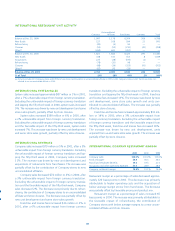
The following table summarizes the estimated impact on
revenue of refranchising, store closures and the contribution of
Company stores to unconsolidated affiliates:
2001
Inter-
U.S. national Worldwide
Reduced sales $ (483) $ (243) $ (726)
Increased franchise fees 21 13 34
Reduction in total revenues $ (462) $ (230) $ (692)
2000
Inter-
U.S. national Worldwide
Reduced sales $ (838) $ (246) $ (1,084)
Increased franchise fees 39 13 52
Reduction in total revenues $ (799) $ (233) $ (1,032)