Pizza Hut 2001 Annual Report Download - page 61
Download and view the complete annual report
Please find page 61 of the 2001 Pizza Hut annual report below. You can navigate through the pages in the report by either clicking on the pages listed below, or by using the keyword search tool below to find specific information within the annual report.-
 1
1 -
2
-
3
-
4
-
5
-
6
-
7
-
8
-
9
-
10
-
11
-
12
-
13
-
14
-
15
-
16
-
17
-
18
-
19
-
20
-
21
-
22
-
23
-
24
-
25
-
26
-
27
-
28
-
29
-
30
-
31
-
32
-
33
-
34
-
35
-
36
-
37
-
38
-
39
-
40
-
41
-
42
-
43
-
44
-
45
-
46
-
47
-
48
-
49
-
50
-
 51
51 -
 52
52 -
 53
53 -
 54
54 -
 55
55 -
 56
56 -
 57
57 -
 58
58 -
 59
59 -
 60
60 -
 61
61 -
 62
62 -
 63
63 -
 64
64 -
 65
65 -
 66
66 -
 67
67 -
 68
68 -
 69
69 -
 70
70 -
 71
71 -
72
 |
 |

59
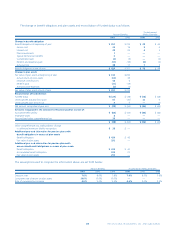
The details of 2001 and 2000 deferred tax liabilities (assets) are
set forth below:
2001 2000
Intangible assets and property, plant
and equipment $ 176 $ 184
Other 29 35
Gross deferred tax liabilities $ 205 $ 219
Net operating loss and tax credit carryforwards $ (171) $ (142)
Employee benefits (73) (82)
Self-insured casualty claims (62) (55)
Various liabilities and other (274) (214)
Gross deferred tax assets (580) (493)
Deferred tax assets valuation allowances 130 132
Net deferred tax assets (450) (361)
Net deferred tax (assets) liabilities $ (245) $ (142)
Reported in Consolidated Balance Sheets as:
Deferred income tax assets $ (79) $ (75)
Other assets (166) (78)
Accounts payable and other current liabilities —1
Deferred income taxes —10
$ (245) $ (142)
Our valuation allowance related to deferred tax assets decreased
by $2 million in 2001 primarily due to the previously discussed
change in circumstances, partially offset by increases in valua-
tion allowances related to deferred tax assets in certain foreign
countries and states.
A determination of the unrecognized deferred tax liability
for temporary differences related to our investments in foreign
subsidiaries and investments in foreign unconsolidated affiliates
that are essentially permanent in duration is not practicable.
We have available net operating loss and tax credit carry-
forwards totaling approximately $1.1 billion at December 29,
2001 to reduce future tax of TRICON and certain subsidiaries.
The carryforwards are related to a number of foreign and state
jurisdictions. Of these carryforwards, $15 million expire in 2002
and $910 million expire at various times between 2003 and
2020. The remaining carryforwards of approximately $150 mil-
lion do not expire.
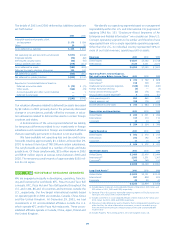
REPORTABLE OPERATING SEGMENTS
We are engaged principally in developing, operating, franchis-
ing and licensing the worldwide KFC, Pizza Hut and Taco Bell
concepts. KFC, Pizza Hut and Taco Bell operate throughout the
U.S. and in 84, 86 and 13 countries and territories outside the
U.S., respectively. Our five largest international markets based
on operating profit in 2001 are Australia, Canada, China, Korea
and the United Kingdom. At December 29, 2001, we had
investments in 10 unconsolidated affiliates outside the U.S.
which operate KFC and/or Pizza Hut restaurants. These uncon-
solidated affiliates operate in Canada, China, Japan, Poland and
the United Kingdom.
21
NOTE
We identify our operating segments based on management
responsibility within the U.S. and International. For purposes of
applying SFAS No. 131 “Disclosure About Segments of An
Enterprise and Related Information” we consider our three U.S.
Concept operating segments to be similar and therefore have
aggregated them into a single reportable operating segment.
Other than the U.S., no individual country represented 10% or
more of our total revenues, operating profit or assets.
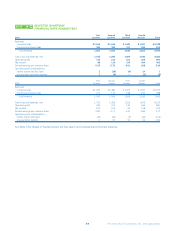
Revenues 2001 2000 1999
United States $ 4,827 $ 5,062 $ 5,748
International 2,126 2,031 2,074
$ 6,953 $ 7,093 $ 7,822
Operating Profit; Interest Expense,
Net; and Income Before Income Taxes 2001 2000 1999
United States $ 722 $ 742 $ 828
International(a) 318 309 265
Unallocated and corporate expenses (148) (163) (180)
Foreign exchange net (loss) (3) — (3)
Facility actions net (loss) gain(b) (1) 176 381
Unusual items income (expense)(b) 3(204) (51)
Total operating profit 891 860 1,240
Interest expense, net 158 176 202
Income before income taxes $ 733 $ 684 $ 1,038
Depreciation and Amortization 2001 2000 1999
United States $ 224 $ 231 $ 266
International 117 110 110
Corporate 13 13 10
$ 354 $ 354 $ 386
Capital Spending 2001 2000 1999
United States $ 392 $ 370 $ 315
International 232 192 139
Corporate 12 10 16
$ 636 $ 572 $ 470
Identifiable Assets 2001 2000 1999
United States $ 2,489 $ 2,400 $ 2,444
International(c) 1,593 1,501 1,367
Corporate(d) 306 248 150
$ 4,388 $ 4,149 $ 3,961
Long-lived Assets(e) 2001 2000 1999
United States $ 2,203 $ 2,101 $ 2,143
International 987 828 874
Corporate 45 30 41
$ 3,235 $ 2,959 $ 3,058
(a) Includes equity income of unconsolidated affiliates of $26 million, $25 million and
$22 million in 2001, 2000 and 1999, respectively.
(b) See Note 5 for a discussion by reportable operating segment of facility actions net
(loss) gain and unusual items income (expense).
(c) Includes investment in unconsolidated affiliates of $213 million, $257 million and
$170 million for 2001, 2000 and 1999, respectively.
(d) Primarily includes deferred tax assets, Property, Plant and Equipment related to our
office facilities, fair value of derivative instruments, accounts receivable arising
from the AmeriServe bankruptcy reorganization process and unamortized debt
issuance costs.
(e) Includes Property, Plant and Equipment, net and Intangible Assets, net.