Pizza Hut 2001 Annual Report Download - page 40
Download and view the complete annual report
Please find page 40 of the 2001 Pizza Hut annual report below. You can navigate through the pages in the report by either clicking on the pages listed below, or by using the keyword search tool below to find specific information within the annual report.-
 1
1 -
2
-
3
-
4
-
5
-
6
-
7
-
8
-
9
-
10
-
11
-
12
-
13
-
14
-
15
-
16
-
17
-
18
-
19
-
20
-
21
-
22
-
23
-
24
-
25
-
26
-
27
-
28
-
29
-
 30
30 -
 31
31 -
 32
32 -
 33
33 -
 34
34 -
 35
35 -
 36
36 -
 37
37 -
 38
38 -
 39
39 -
 40
40 -
 41
41 -
 42
42 -
 43
43 -
 44
44 -
 45
45 -
 46
46 -
 47
47 -
 48
48 -
 49
49 -
 50
50 -
51
-
52
-
53
-
54
-
55
-
56
-
57
-
58
-
59
-
60
-
61
-
62
-
63
-
64
-
65
-
66
-
67
-
68
-
69
-
70
-
71
-
72
 |
 |

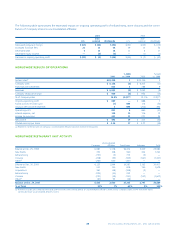
38 TRICON GLOBAL RESTAURANTS, INC. AND SUBSIDIARIES
Consolidated Statements of Income
Fiscal years ended December 29, 2001, December 30, 2000 and December 25, 1999
(in millions, except per share data) 2001 2000 1999
Revenues
Company sales $ 6,138 $6,305 $7,099
Franchise and license fees 815 788 723
6,953 7,093 7,822
Costs and Expenses, net
Company restaurants
Food and paper 1,908 1,942 2,238
Payroll and employee benefits 1,666 1,744 1,956
Occupancy and other operating expenses 1,658 1,665 1,814
5,232 5,351 6,008
General and administrative expenses 796 830 895
Franchise and license expenses 59 49 25
Other (income) expense (23) (25) (16)
Facility actions net loss (gain) 1(176) (381)
Unusual items (income) expense (3) 204 51
Total costs and expenses, net 6,062 6,233 6,582
Operating Profit 891 860 1,240
Interest expense, net 158 176 202
Income Before Income Taxes 733 684 1,038
Income Tax Provision 241 271 411
Net Income $ 492 $ 413 $ 627
Basic Earnings Per Common Share $ 3.36 $ 2.81 $ 4.09
Diluted Earnings Per Common Share $ 3.24 $ 2.77 $ 3.92
See accompanying Notes to Consolidated Financial Statements.