Pizza Hut 2001 Annual Report Download - page 51
Download and view the complete annual report
Please find page 51 of the 2001 Pizza Hut annual report below. You can navigate through the pages in the report by either clicking on the pages listed below, or by using the keyword search tool below to find specific information within the annual report.-
 1
1 -
2
-
3
-
4
-
5
-
6
-
7
-
8
-
9
-
10
-
11
-
12
-
13
-
14
-
15
-
16
-
17
-
18
-
19
-
20
-
21
-
22
-
23
-
24
-
25
-
26
-
27
-
28
-
29
-
30
-
31
-
32
-
33
-
34
-
35
-
36
-
37
-
38
-
39
-
40
-
 41
41 -
 42
42 -
 43
43 -
 44
44 -
 45
45 -
 46
46 -
 47
47 -
 48
48 -
 49
49 -
 50
50 -
 51
51 -
 52
52 -
 53
53 -
 54
54 -
 55
55 -
 56
56 -
 57
57 -
 58
58 -
 59
59 -
 60
60 -
 61
61 -
62
-
63
-
64
-
65
-
66
-
67
-
68
-
69
-
70
-
71
-
72
 |
 |

49
general liability and automobile liability insurance programs. The
change in methodology resulted in a one-time increase in our
1999 operating profit of over $8 million.
At the end of 1998, we changed our method of determin-
ing the pension discount rate to better reflect the assumed
investment strategies we would most likely use to invest any
short-term cash surpluses. The pension discount methodology
change resulted in a one-time increase in our 1999 operating
profit of approximately $6 million.
In 1999, our vacation policies were conformed to a calen-
dar-year based, earn-as-you-go, use-or-lose policy. The change
provided a one-time favorable increase in our 1999 operating
profit of approximately $7 million. Other accounting policy stan-
dardization changes by our three U.S. Concepts provided a
one-time favorable increase in our 1999 operating profit of
approximately $1 million.
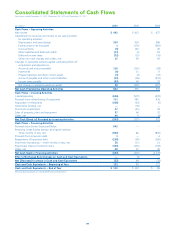
SUPPLEMENTAL CASH FLOW DATA
2001 2000 1999
Cash Paid for:
Interest $ 164 $ 194 $ 212
Income taxes 264 252 340
Significant Non-Cash Investing
and Financing Activities:
Issuance of promissory note to
acquire an unconsolidated affiliate $— $25 $—
Contribution of non-cash net assets
to an unconsolidated affiliate 21 67 —
Assumption of liabilities in connection
with an acquisition 36 61
Fair market value of assets
received in connection with
a non-cash acquisition 9——
Capital lease obligations incurred
to acquire assets 18 44
FRANCHISE AND LICENSE FEES
2001 2000 1999
Initial fees, including renewal fees $32 $48 $71
Initial franchise fees included in
refranchising gains (7) (20) (45)
25 28 26
Continuing fees 790 760 697
$ 815 $ 788 $ 723
7
NOTE
6
NOTE
OTHER (INCOME) EXPENSE
2001 2000 1999
Equity income from investments
in unconsolidated affiliates $ (26) $ (25) $ (19)
Foreign exchange net loss 3—3
$ (23) $ (25) $ (16)
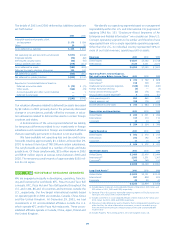
PROPERTY, PLANT AND
EQUIPMENT, NET
2001 2000
Land $ 579 $ 543
Buildings and improvements 2,608 2,469
Capital leases, primarily buildings 91 82
Machinery and equipment 1,647 1,522
4,925 4,616
Accumulated depreciation and amortization (2,121) (2,056)
Impairment allowances (27) (20)
$ 2,777 $ 2,540
Depreciation and amortization expense was $320 million,
$319 million and $345 million in 2001, 2000 and 1999,
respectively.
INTANGIBLE ASSETS, NET
2001 2000
Reacquired franchise rights $ 294 $ 264
Trademarks and other identifiable intangibles 105 102
Goodwill 59 53
$ 458 $ 419
In determining the above amounts, we have subtracted accu-
mulated amortization of $410 million for 2001 and $415 million
for 2000. Amortization expense was $37 million, $38 million
and $44 million in 2001, 2000 and 1999, respectively.
ACCOUNTS PAYABLE AND OTHER
CURRENT LIABILITIES
2001 2000
Accounts payable $ 326 $ 326
Accrued compensation and benefits 210 209
Other current liabilities 459 443
$ 995 $ 978
11
NOTE
10
NOTE
9
NOTE
8
NOTE